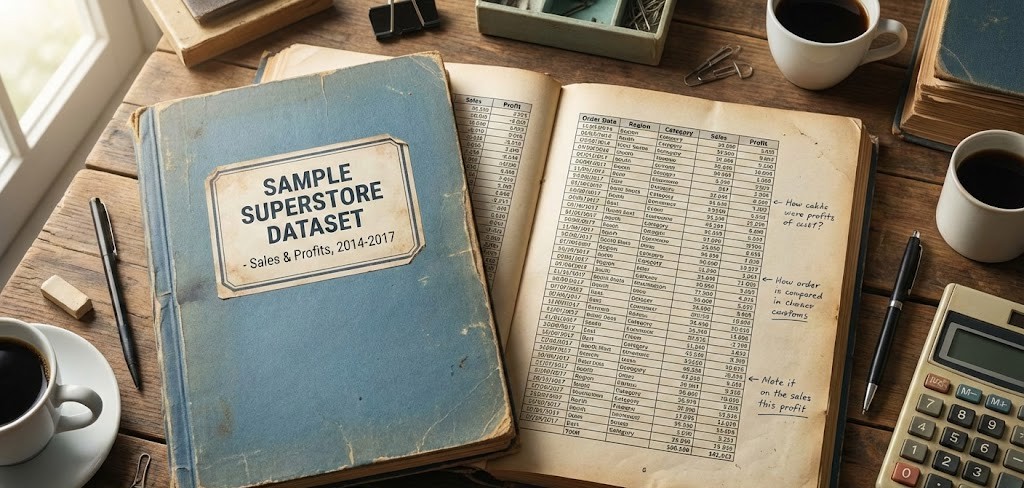
สำหรับโปรเจค Sample Superstore Dataset เรียนรู้เพื่อที่จะสามารถดึงข้อมูลจาก Kaggle มาเพื่อวิเคราะห์ต่อใน Python ได้โดยการใช้ library ที่ชื่อ pandas ช่วยวิเคราะห์ข้อมูลออกมาข้อมูลเหล่านี้เราดึงคำสั่งอะไรและได้ประโยชน์อะไรบ้างครับ
Dataset
https://www.kaggle.com/datasets/bravehart101/sample-supermarket-dataset
Github
- Import data from kaggle
- Create file_path
- Create variable
- Check head
- Check information of data
- Check nunique Column
- Check NA value
- Create Question for business
Import data from kaggle
- ต้องมาเริ่มที่ process การดึงข้อมูลมาจาก Kaggle ก่อนครับ
# Install dependencies as needed:
# pip install kagglehub[pandas-datasets]
import kagglehub
from kagglehub import KaggleDatasetAdapter
เป็นการ import library เพื่อขอใช้เครื่องมือชื่อ kagglehub และขอใช้ตัวแปลงข้อมูล (Adapter) เพื่อเตรียมแปลงข้อมูลที่โหลดมาให้เป็นรูปแบบที่เราต้องการ KaggleDatasetAdapter
# Set the path to the file you'd like to load
file_path = "SampleSuperstore.csv"
Create file_path
ตั้งชื่อไฟล์ว่า file_path จากข้อมูล SampleSuperstore.csv ในหน้า website โดยเป็นการระบุว่าต้องชื่อไฟล์ SampleSuperstore.csv เท่านั้น
Create variable
# Load the latest version
df = kagglehub.load_dataset(
  KaggleDatasetAdapter.PANDAS,
  "bravehart101/sample-supermarket-dataset",
  file_path,
  # Provide any additional arguments like
  # sql_query or pandas_kwargs. See the
  # documenation for more information:
  # https://github.com/Kaggle/kagglehub/blob/main/README.md#kaggledatasetadapterpandas
)
df: คือตัวแปรที่จะเก็บข้อมูลทั้งหมดในรูปแบบตาราง (DataFrame) เมื่อโหลดเสร็จแล้วKaggleDatasetAdapter.PANDAS: เป็นคำสั่งพิเศษที่บอกว่า “เมื่อโหลดเสร็จแล้ว ช่วยแปลงไฟล์ CSV นั้นให้เป็น Pandas DataFrame ให้เลยนะ” (ไม่ต้องมาสั่งpd.read_csv()เองทีหลัง)"bravehart101/sample-supermarket-dataset": นี่คือ “ที่อยู่” หรือ ID ของ Dataset บนเว็บ Kaggle ครับ (เจ้าของคือ bravehart101)
Check head
- สามารถเช็คเป็นชื่อ Column แล้วเช็คเป็นชื่อแถวได้
## Check Head
df.head()
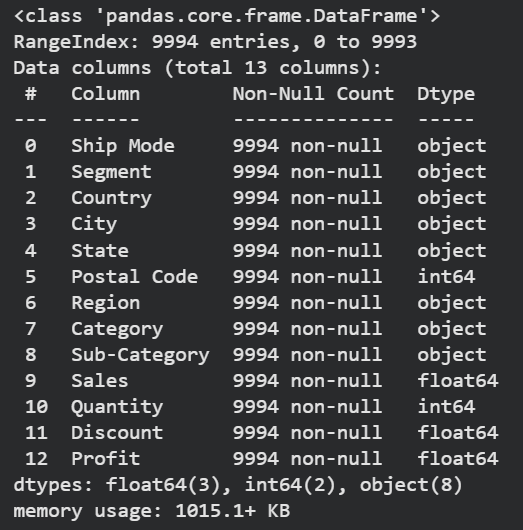
Check information of data
สามารถเช็คเป็นชื่อ Column แล้วเช็คเป็นชื่อแถวได้
- สามารถดูขนาดของข้อมูลได้ว่ามีทั้งหมด 9,994 แถว
- สามารถดู missing value ของข้อมูลได้ว่า ตั้งแต่ Column 0-12 ไม่มีช่องว่างเลย
- สามารถดูประเภทของข้อมูลได้ว่ามีทั้งหมด 3 ประเภท 1. object คือข้อความที่เป็น text 2. int64 ข้อความจำนวนเต็ม 3. float64 ตัวเลขที่เป็นทศนิยม
- สามารถรู้ชื่อ column ได้ตั้งแต่ column (ship_mode จนถึง profit)
## Check Info
df.info()
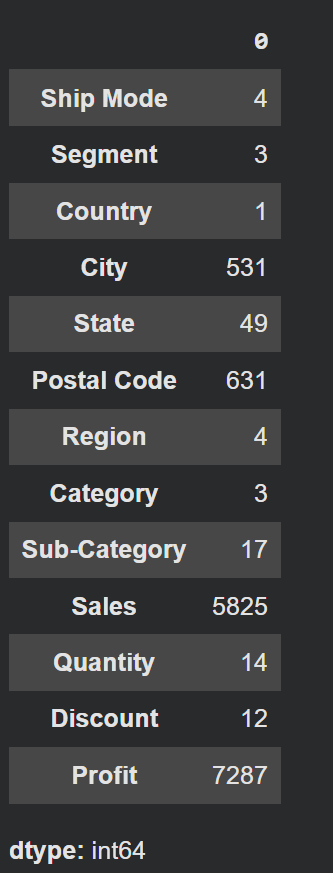
Check nunique Column
- สามารถเช็คได้ว่า การนับว่ามีข้อมูลที่ ‘ไม่ซ้ำกัน’ อยู่กี่ตัว
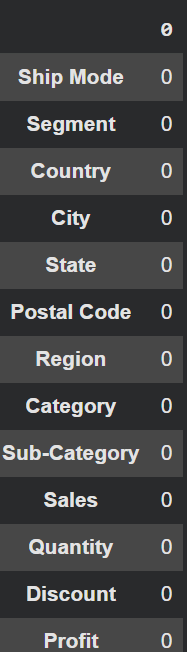
Check NA value
## check NA Value
df.isnull().sum()
- สามารถดูข้อมูลว่า ในตาราง df ที่เราสร้างมี column ไหนที่ไม่เท่ากับ 0 เราสามารถ missing_value ให้ column เหล่านั้นได้
Create Question for business
Overall of business
- ตลอดทั้ง Dataset บริษัทเรามียอดขายรวม (Sales) และกำไรรวม (Profit) ทั้งหมดเท่าไหร่?
- เราไปสามารถไปนับข้อมูลได้ผ่าน column Sales และ Profit ดังนี้ครับ
## df.sales all product
pd.options.display.float_format = '{:,.2f}'.format
df[['Sales', 'Profit']].sum()
| Sale | 2,297,200.86 |
| Profit | 286,397.02 |
- สามารถทำให้รู้ได้ว่า Superstore Dataset มีค่า Sale ราคาเท่าไรและมี profit ราคาเท่าไรบ้างครับ
Sub-Category
- สามารถทำให้ได้รู้ Sub-Category ทั้งหมดกี่อัน
# ส่งค่ากลับมาเป็นตัวเลข (int) เช่น 17
sub_category_unique = df['Sub-Category'].unique()
print(f"Order: {sub_category_unique}\nCount: {len(sub_category_unique)}")
- Order: [‘Bookcases’ ‘Chairs’ ‘Labels’ ‘Tables’ ‘Storage’ ‘Furnishings’ ‘Art’ ‘Phones’ ‘Binders’ ‘Appliances’ ‘Paper’ ‘Accessories’ ‘Envelopes’ ‘Fasteners’ ‘Supplies’ ‘Machines’ ‘Copiers’]
- Count: 17
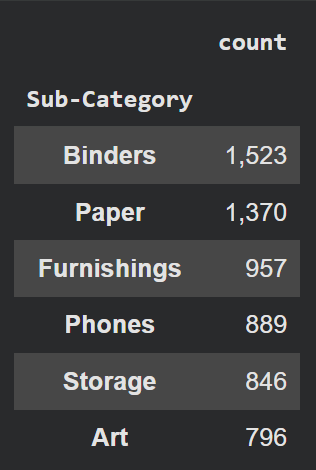
- สามารถรู้ได้ว่า Sub-Category ไหนที่มีคนสนใจเยอะสุดทั้ง 6 ประเภท
## df.sub-Category type
df['Sub-Category'].value_counts().head(6).to_frame()
Segment
โดยหากลุ่มลูกค้า (Segment) กลุ่มไหน (Consumer, Corporate, Home Office) ซื้อของกับเราเยอะที่สุด (วัดจากยอดขาย)?
## What segment buy most
sales_by_segment = df.groupby('Segment')['Sales'].sum()
print(sales_by_segment.apply(lambda x: "{:,.2f}".format(x)))
| Segment | Sale |
| Consumer | 1,161,401.34 |
| Corporate | 706,146.37 |
| Home Office | 429,653.15 |
- มีการขายของกับ Segment ลูกค้าที่เป็น B2C (Business to Consumer) มากที่สุด รองมาเป็น B2B (Business to Business) อันดับสุดท้ายคือ SOHO (Small Office / Home Office)
Ship Mode
- การจัดส่งแบบไหน (Ship Mode) ที่ลูกค้าเลือกใช้บ่อยที่สุด และแบบไหนส่งสินค้าออกไปน้อยที่สุด?
## ship frequency
count_ship_mode = df['Ship Mode'].value_counts().to_frame()
print(count_ship_mode)
| Ship Mode | Count |
| Standard Class | 5,968 |
| Second Class | 1,945 |
| First Class | 1,538 |
| Same Day | 543 |
- ทำให้รู้ว่าส่วนใหญ่ ลูกค้าชอบของที่มีการขนส่งตามเวลาไปปกติ ส่วนลูกค้าที่ต้องให้ของส่งด่วนนั้นมีน้อยที่สุด
Profit per Region
- ภูมิภาคไหน (Region) ทำยอดขายได้สูงที่สุด? และภูมิภาคนั้นทำกำไรได้ดีที่สุดด้วยหรือไม่?
## the most Profit form region
region_sum = df.groupby("Region")[['Sales','Profit']].sum().sort_values(by='Profit', ascending=False)
print(region_sum)
| Region | Sales | Profit |
| West | 725,457.82 | 108,418.45 |
| East | 678,781.24 | 91,522.78 |
| South | 391,721.91 | 46,749.43 |
| Central | 501,239.89 | 39,706.36 |
- สามารถรู้ได้ว่า Region ที่ขายดีที่สุด คือ Region West ที่ Sales ราคา 725,457.82 และ Profit เยอะสุดที่ 108,418.45 ครับ
The weak
- สินค้าหมวดย่อย (Sub-Category) ไหน ที่รวมแล้วทำให้บริษัท “ขาดทุน” มากที่สุด? (Sum Profit ติดลบเยอะสุด)
## Sub-Category that make company Loss the most is.
the_most_loss = df.groupby("Sub-Category")['Profit'].sum().sort_values(ascending=True).head()
print(the_most_loss)
| Sub-Category | Profit |
| Table | -17,725.48 |
| Bookcases | -3,472.55 |
| Supplies | -1,189.09 |
| Fasteners | 949.51 |
| Machines | 3,384.75 |
- แสดงว่า สามารถพิจารณาได้ว่า Tables, Bookcases, Supplies ขาดทุนจะต้องปรับราคาและการขายของ 3 สินค้านี้ครับ
State
- รัฐไหน (State) ที่เรามียอดขายเยอะ (Top 10) แต่กำไรกลับติดลบ? (ยอดขายหลอกตาให้รู้สึกว่า Sale เยอะ!)
## the most state most sale but profit less
the_most_state = df.groupby("State")[['Profit','Sales']].sum().sort_values(by='Profit', ascending=True)
print(the_most_state)
| State | Profit | Sales |
| Texas | -25,729.36 | 170,188.05 |
| Ohio | -16,791.38 | 78,258.14 |
| Pennsylvania | -15,559.96 | 116,511.91 |
| Illinois | -12,607.89 | 80,166.10 |
| North Carolina | -7,490.91 | 55,603.16 |
| Colorado | -6,527.86 | 32,108.12 |
| Tennessee | -5,341.69 | 60,661.87 |
| Arizona | -3,427.92 | 35.282.00 |
| Florida | -3,399.30 | 89,473.71 |
| Oregon | -1,190.47 | 17,431.15 |
- sort_values(by=’Profit’, ascending=True) ทำให้รู้ว่ารัฐที่ขาดทุนมีทั้งหมด 10 รัฐดังนี้ โดยเรียงจากขาดทุนมากไปขาดทุนน้อย
- Texas
- Ohio
- Pennsylvania
- Illinois
- North Carolina
- Colorado
- Tennessee
- Arizona
- Florida
- Oregon
จากที่ได้วิเคราะห์มาเบื้องต้นก็ทำให้ได้รู้ว่า
- ธุรกิจมียอดขายรวม 2.3 ล้านเหรียญ โดยมี Region West และลูกค้ากลุ่ม Consumer เป็นตัวแบกหลักที่สร้างยอดขายและกำไรสูงสุด
- สินค้าหมวด Tables และรัฐ Texas คือตัวถ่วงที่น่าเป็นห่วงที่สุด เพราะแม้จะมียอดขายสูงแต่กลับสร้างผลขาดทุนหนักที่สุด (Sales สูงแต่ Profit ติดลบ)
- ข้อมูลชุดนี้ชี้ให้เห็นว่า “ยอดขายเยอะไม่ได้แปลว่ากำไรดี” เสมอไป โดยเฉพาะในกลุ่มสินค้าเฟอร์นิเจอร์บางชนิดและบางรัฐที่ต้องเร่งปรับปรุงโครงสร้างราคาครับ
- หวังว่าบทความนี้จะเป็นประโยชน์ในเรื่องการใช้ pandas ใน Python เบื้องต้นกับทุกท่านครับ ขอบคุณครับ

Leave a comment