Welcome to My Data Analyst Blog
-
7 Key Insights from Sample Superstore Dataset Analysis
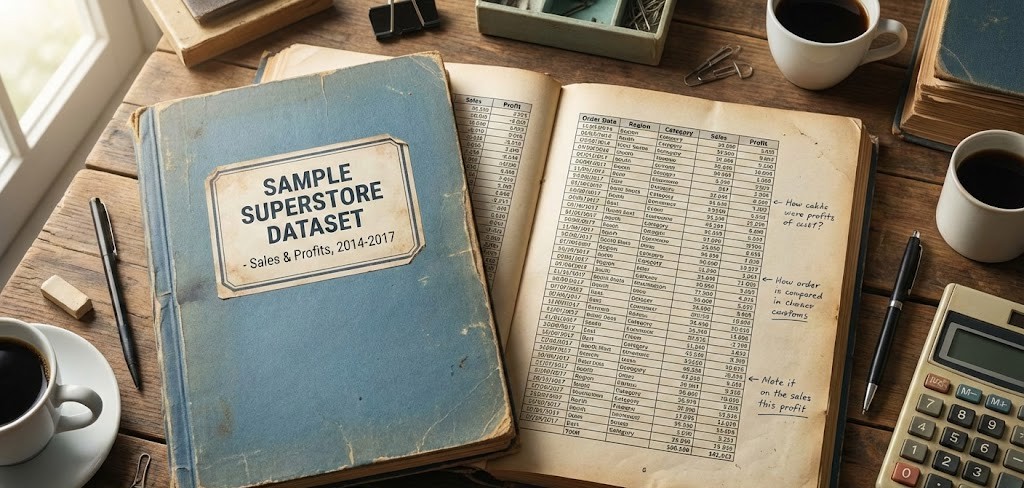
สำหรับโปรเจค Sample Superstore Dataset เรียนรู้เพื่อที่จะสามารถดึงข้อมูลจาก Kaggle มาเพื่อวิเคราะห์ต่อใน Python ได้โดยการใช้ library ที่ชื่อ pandas ช่วยวิเคราะห์ข้อมูลออกมาข้อมูลเหล่านี้เราดึงคำสั่งอะไรและได้ประโยชน์อะไรบ้างครับ
-
10 Topics of Data analysis of the UCI Machine Learning Repository’s Online Retail dataset using R

เป็นบทความสำหรับการวิเคราะห์ข้อมูลเพื่อที่จะหากลุ่มลูกค้าที่จะก็บข้อมูลมาเพื่อหาลูกค้ากลุ่มไหน ควรออกแบบ Campaign เพื่อที่จะสามารถตอบโจทย์และบอกได้ว่ากลุ่มไหนควรแนะนำให้เพิ่มบริการหรือลดบริการ เนื่องจากปัจจุบันการสูญเสียูกค้ากันเยอะขึ้น ในหลายๆ จึงอยากให้หาสาเหตุว่าลูกค้ากลุ่มไหนควรที่จะทำ Campaign อะไรให้เพื่อฟื้นฟูความสัมพันธ์กับลูกค้าเหล่านั้น RFM Feature Engineering คือกระบวนการ “สกัด” หรือ “สร้าง” (Engineering) คุณลักษณะ (Features) ใหม่ 3 ตัว ที่ทรงพลังมากสำหรับการวิเคราะห์การตลาด จากข้อมูลดิบ (Raw Data) ของการซื้อขายครับ
-
5 Sample Case For Intro to Data Science
เป็นบทความที่เขียนเพื่อที่จะช่วยให้สามารถเข้าใจตัวอย่างสำหรับข้อมูลที่มีในปัจจุบันจะมีประโยชน์และสามารถนำไปประยุกต์กับธุรกิจในชีวิตจริงได้อย่างไรบ้าง
-
20 Ideas from Essential Statistics 101

สถิติเป็นวิชาที่เกี่ยวกับการรวบรวม จัดระเบียบ วิเคราะห์ และตีความข้อมูล เพื่อนำไปสู่การตัดสินใจและสรุปผลที่มีหลักเกณฑ์ สถิติมีบทบาทสำคัญในการศึกษา วิจัย และการตัดสินใจในหลากหลายสาขา เช่น วิทยาศาสตร์ สังคมศาสตร์ ธุรกิจ การแพทย์และการตัดสินใจต่างในชีวิตประจำวัน การเรียนรู้สถิติจะช่วยให้เราเข้าใจโลกและตัดสินใจได้อย่างมีเหตุผลมากขึ้น
-
10 Ideas from Google Sheets 101 เพื่อให้สามารถจัดการข้อมูลให้เป็นระเบียบมากขึ้น

บทความเพื่อพัฒนาความเข้าใจให้มากขึ้นสำหรับ Google Sheet คือโปรแกรม Spreadsheet ที่ใช้งานได้ฟรี ทำให้สามารถสร้าง แก้ไข และทำงานร่วมกับผู้อื่นได้แบบ Real-time
-
10 Ideas from Data Science Bootcamp batch 11 Live 01 ที่นอกจากสอน data แล้ว ยังสอนวิธีการเรียนรู้ที่ดีทำให้เปลี่ยน Mindset ให้ดีขึ้นได้ด้วย

การที่มีโอกาสลงเรียน Data Science Bootcamp batch 11 ทำได้รับ mindset ใหม่ๆ เยอะที่ช่วยให้เรามีความมุ่งมั่นเพื่อให้ทำสิ่งต่างๆ สำเร็จ (manifestation) มี W3Schools ให้ศึกษาหาความรู้ดีๆ ได้ตลอดเวลา
-
10 Method for Power BI to build your reports and dashboard

This project explores the use of Power BI to create dashboards that provide insights for improved business planning and decision-making within organizations. It also demonstrates how structured data can be presented in a clear and accessible manner through data storytelling.
-
5 Steps with Project introduction SQL

SQL is a powerful programming language used for managing and manipulating relational databases. It allows users to create, retrieve, update, and delete data efficiently within a database system.
-
5 Steps of Data Analysis By Using Microsoft Excel

Data analyst is an essential tool that enables organizations to gain deeper insights into their data. Utilizing Microsoft Excel for efficient data processing facilitates accurate and prompt decision-making while identifying trends and uncovering new business opportunities.
-
10 Social Listening of Data Analyst สามารถหา trend ของข้อมูลได้

การใช้ social Listening Tools ช่วยให้ลูกค้าสามารถเข้าใจ brand เราได้ ว่าลูกค้าชอบแบรนด์ตรงจุดไหน และเข้าใจ sentiment ของลูกค้าว่ารู้สึกยังไงกับแบรนด์ของเรา
