Data analyst is an essential tool that enables organizations to gain deeper insights into their data. Utilizing Microsoft Excel for efficient data processing facilitates accurate and prompt decision-making while identifying trends and uncovering new business opportunities.
Excel work with a prepared spreadsheet that contains sale
The 5 steps for analyzing the sales_data_analysis.xlsx file in Microsoft Excel 365 are as follows
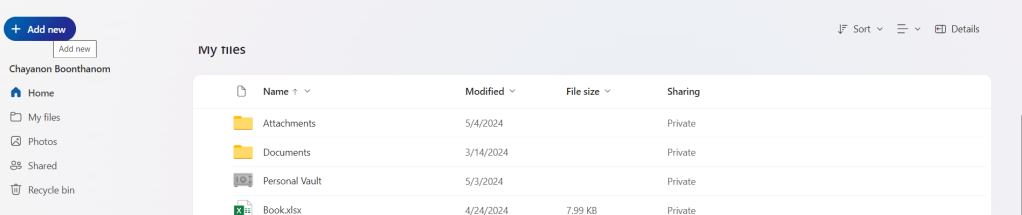
Upload a document using the free online version of Microsoft Office 365
One drive to upload excel file
Click add new → File upload → then upload → sales_data_analysis_23.10.2024
Go to Insert → Table to create a table that uses the header in the first column to filter data. → Click OK.
To Createa table to filter data, see the picture below.
Create Table in microsoft excel 365
Then filter the data shown in the picture below.
can filter data by columns such as Num, Date, Month, Sales Rep, Region, Customer ID, etc.
Set it up so that when you scroll down to view data in the rows below, the first column remains visible. This makes it much easier to reference the headings.
Perform data analysis using sorting and filter tools.
Which column should be prioritized for sorting data to make it more effective?
representative header and then select sort A to Z to sort it in alphabetical order
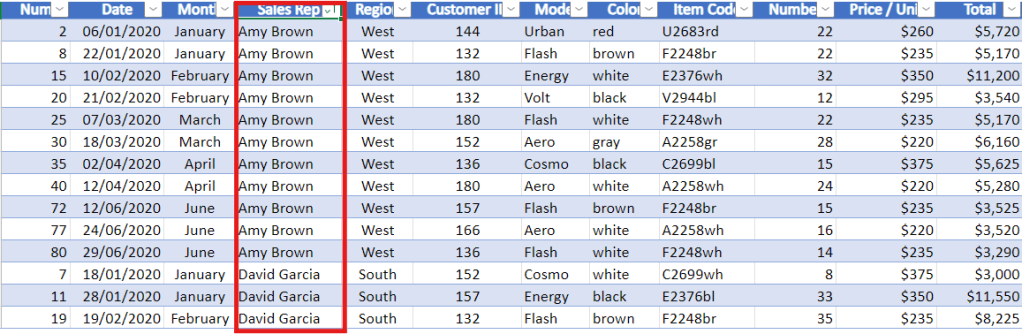
Sort the Sales Rep column from A to Z.
after click it has been rearrange by alphabetical Sales Rep
then to make it back to select sort in column date again
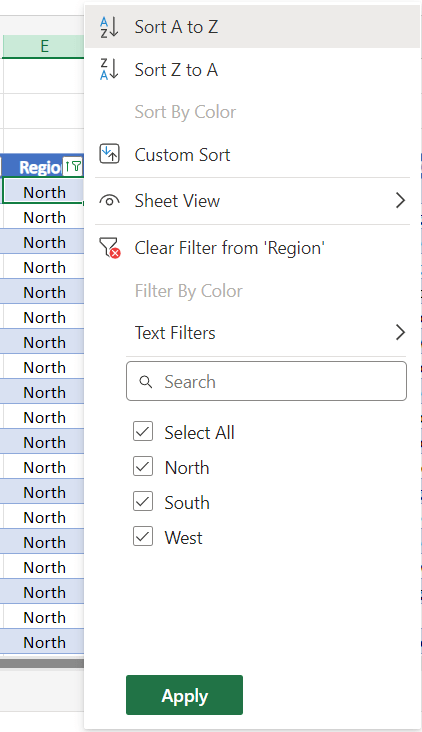
can sort the Region by North.
Filter by North Region.
To remove the filter, click the ‘Select All‘ checkbox to display sales from the North, South, and West regions, and then click.
Then filter the Sales Rep column by the name David Garcia.
Calculate in the bottom right corner.
What you can see from data?
Average of $7,893
Count of 9
Sum of $71,040
you can see aggregate value in the bottom right corner.
This is how to use the sorting and filtering tools to rearrange your data.
Perform data mining using the IF Function
The idea behind data mining is to take the data you already have and create new or additional data from it.
The IF function is frequently used.
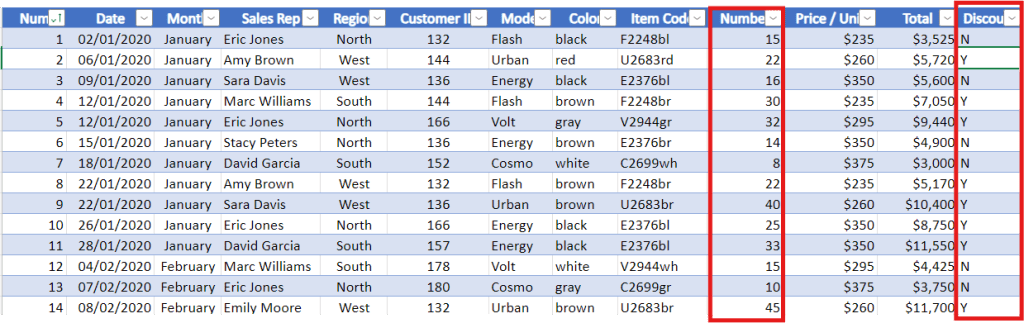
Samples show that when an order includes 20 chairs or more, the client receives a 5% wholesale discount.
Discount Column 3 Method
1. Create a discount column to the right to reflect this.
2. In the column, use ‘Y‘ for orders with a quantity ≥ 20.
3. In the column, use ‘N‘ for orders with a quantity ≤ 20.
Code for column Discount
=IF(J5>=20,"Y","N")
Create a discount column based on the quantity in the number column.
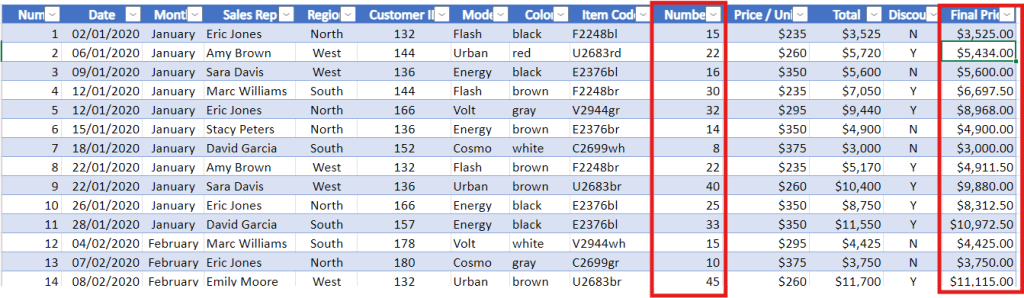
Final Price column
Code for column Final Price
=IF(J5>20,0.95*L5,L5)
Create a Final Price column based on discount and number column.
column of Discount with Y is number ≥ 20 price is discount 5% final is 95% from total column
column of Discount with N is number ≤ 20 price is same as the total
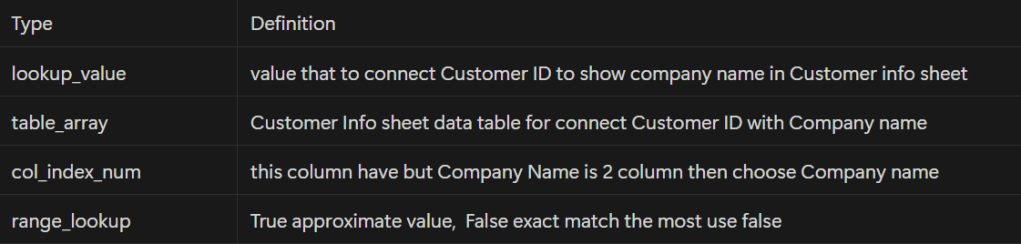
Create references between tables and search for information with VLOOKUP
Goal is to insert the company name using the client ID.
Create column Company Name between Customer ID and Color
Create column Company Name Representative between Company name and model
Data analysts help organizations gain valuable insights from data. Using Microsoft Excel enhances decision-making by processing data efficiently and identifying trends and opportunities.
สามารถดึงข้อมูลจาก Social Media Platforms ด้วยตัวเอง เช่น Facebook, Instagram, Twitter โดยใช้ Supermetrics + Google Sheets
Google Sheets & Looker Studio
โดย 2 เครื่องมือที่นิยมใช้ในงาน Social Listening คือ Excel/ Google Sheets และ BI Tools เช่น Looker Studio หรือ Power BI เพื่อทำรายงาน dashboard ติดตามผลง่ายๆ
ใช้สำหรับ Social Listening ใช้ Google Sheets + Looker Studio เป็นหลัก
Case Study : Oppo Find N2 Flip Launch
ทีมการตลาดของ Oppo Global ได้หา insights ว่าลูกค้าที่ใช้โทรศัพท์จอพับมีปัญหาอะไรบ้าง (จากการทำ research และ social listening) พบว่าสามปัญหาที่ลูกค้าบ่นเยอะที่สุดคือ
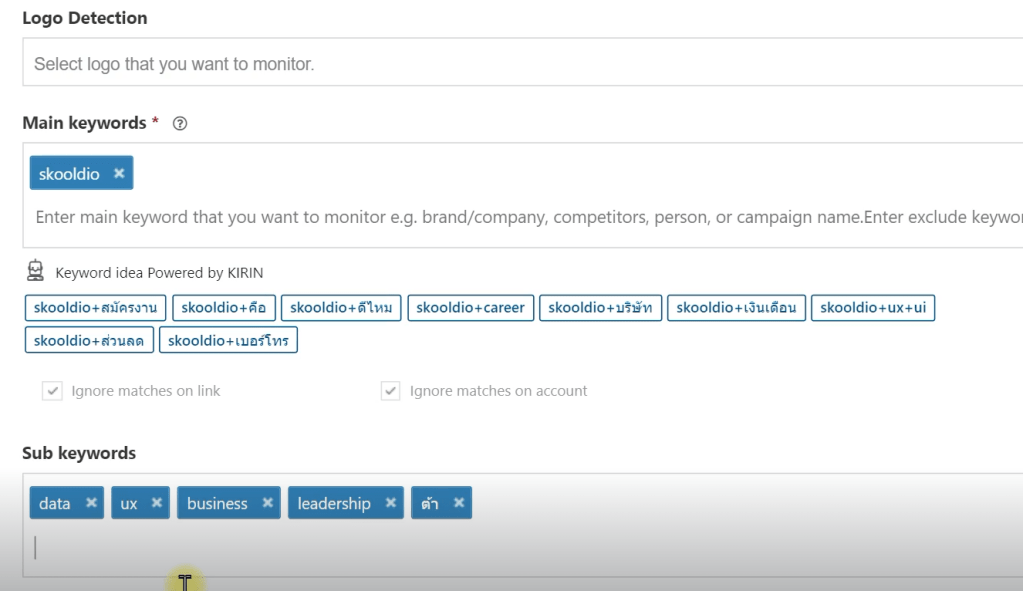
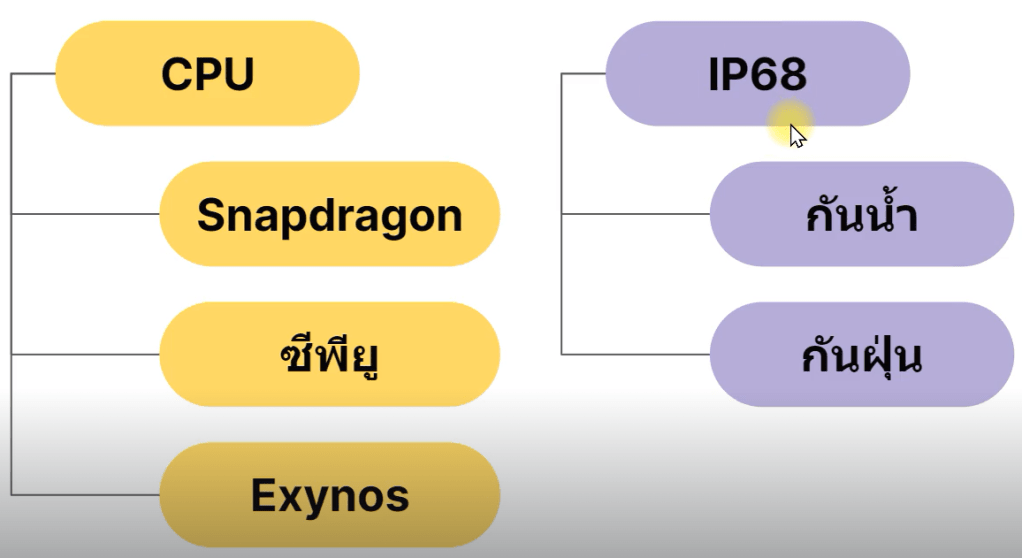
ระหว่าง Extract กับ Analyze ใช้ Negative key word ในการดึงข้อมูลที่ไม่สำคัญทิ้งไป
Sub keyword ใช้ในการวิเคราะห์ เช่น กล้อง ราคา promotion
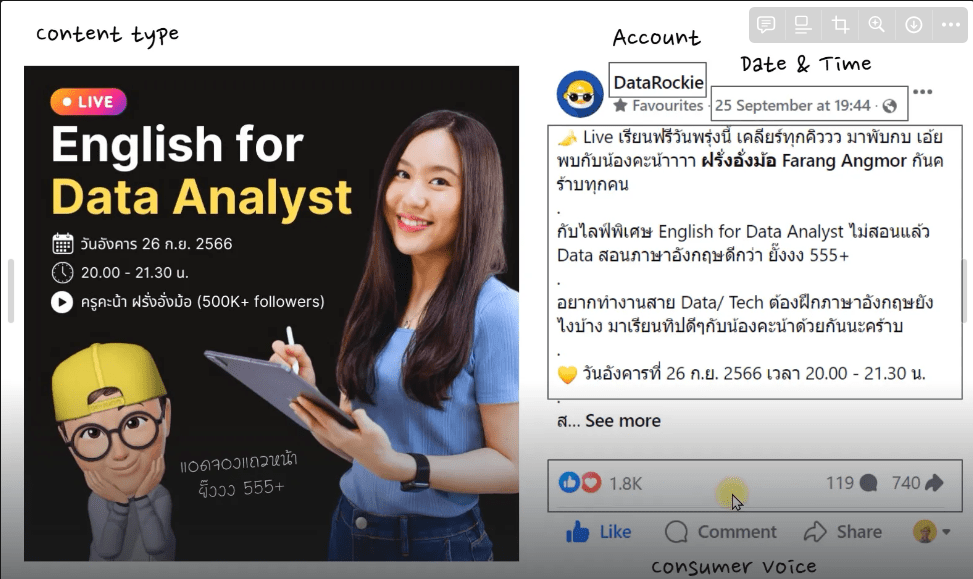
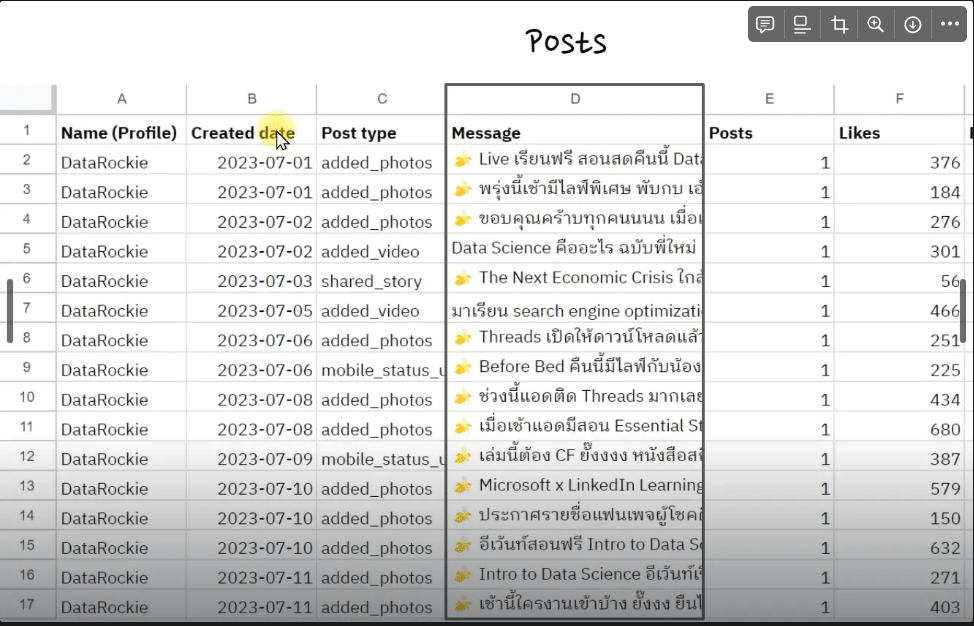
Zocial Eye Dashboard รูปภาพจาก Social Listening — Data Analyst Edition by DataRockie
Extract Data for Zocial Eye
Extract Data From Platform
การดึงข้อมูลจาก Platform ต่างๆ
Facebook Data
Instagram Data
Application Program Interface
Facebook Data
จะเริ่มดึงข้อมูลจาก Social Media Platform โดยใช้ Supermetrics ในการดึงข้อมูลจาก facebook public page
สามารถใช้ application นี้ฟรี 14 วัน
ตัวอย่างนี้เป็นการลองดึงข้อมูลจาก Facebook Public Post แบบง่ายๆด้วย Supermetrics แค่เลือก data source -> page -> period -> dimensions/ metrics ที่ต้องการ
Instagram Data
Extract ข้อมูลผ่าน IG Data
โดยการดึงข้อมูลจาก Instagram ผ่าน hashtag
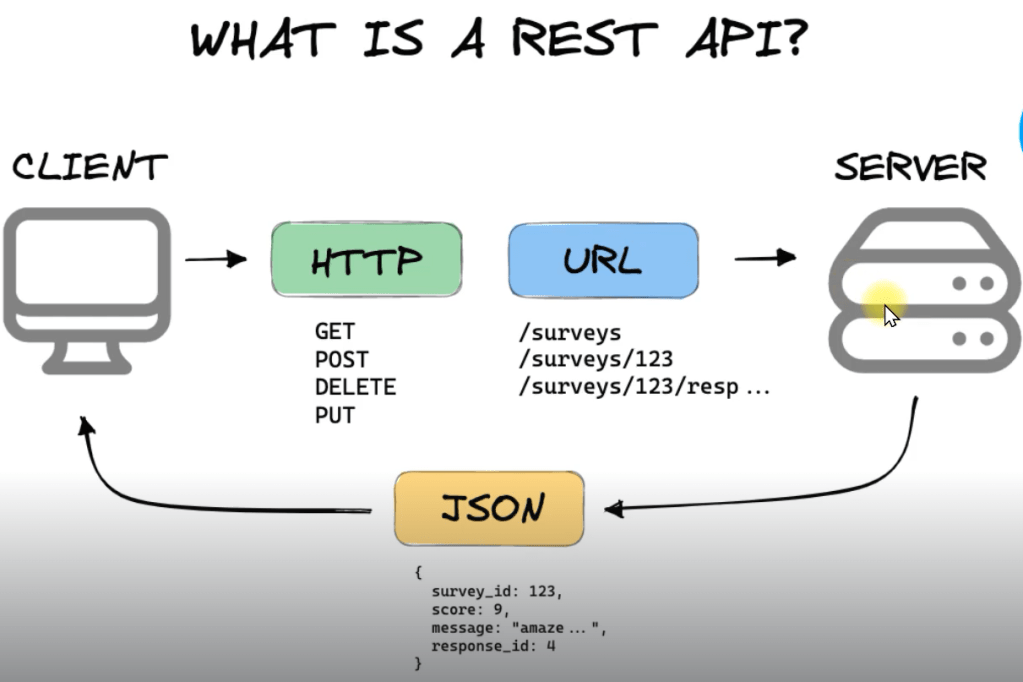
Application Program Interface
รูปภาพ API Process จาก Social Listening — Data Analyst Edition by DataRockie
API ย่อมาจาก “Application Program Interface” (ส่วนต่อประสานโปรแกรมประยุกต์) ในบริบทของ API คำว่า “Application” หมายถึงทุกซอฟต์แวร์ที่มีฟังก์ชันชัดเจน ส่วน “Interface” อาจถือเป็นสัญญาบริการระหว่างสองแอปพลิเคชัน ซึ่งสัญญานี้จะกำหนดวิธีที่ทั้งสองสื่อสารกันโดยใช้คำขอและการตอบกลับ
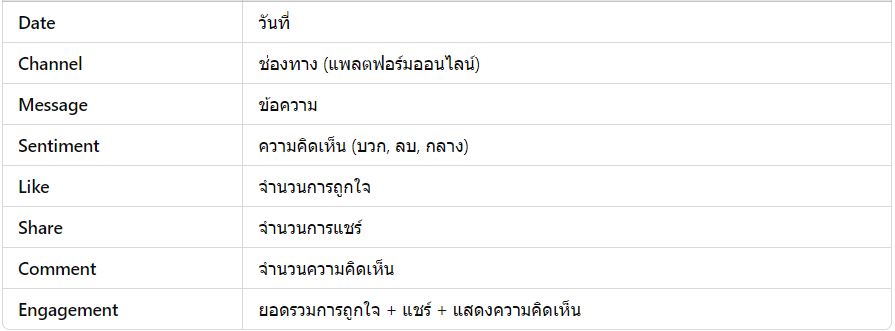
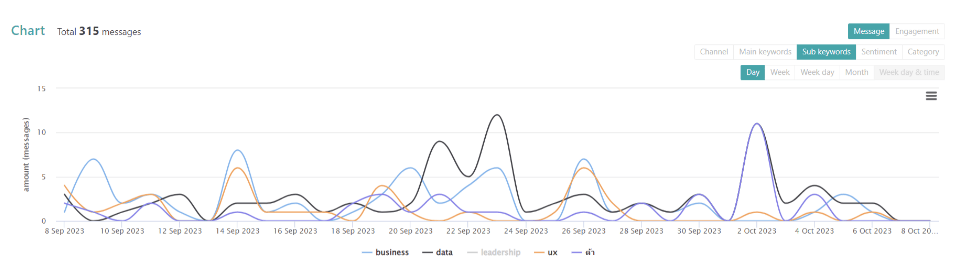
รูปภาพ keyword and sub keyword จาก Social Listening — Data Analyst Edition by DataRockie
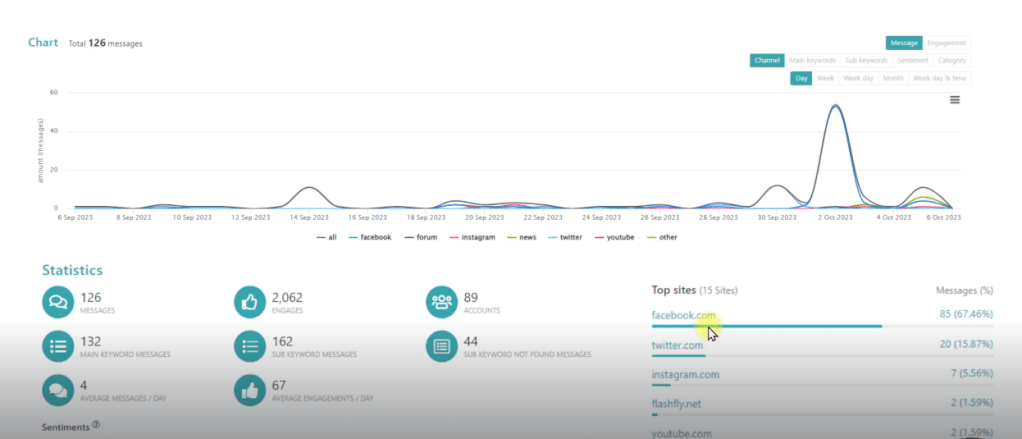
Check Period
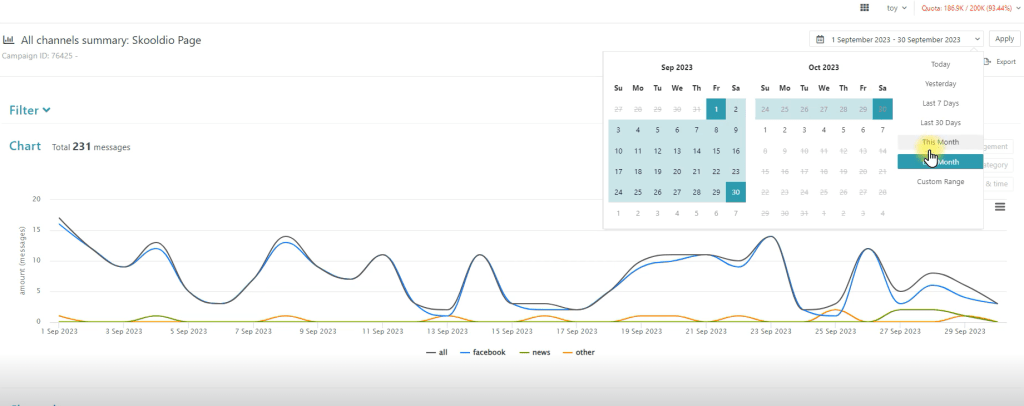
หาช่วงเวลาให้ตรงกับที่เราสนใจก่อน แล้วจะได้เปรียบเทียบข้อมูลทั้ง 3 platform facebook, new and other
check period หาช่วงเวลาให้ตรงกับที่เราสนใจก่อน แล้วจะได้เปรียบเทียบข้อมูลทั้ง 3 platform facebook, new and other รูปภาพจาก Social Listening — Data Analyst Edition by DataRockie
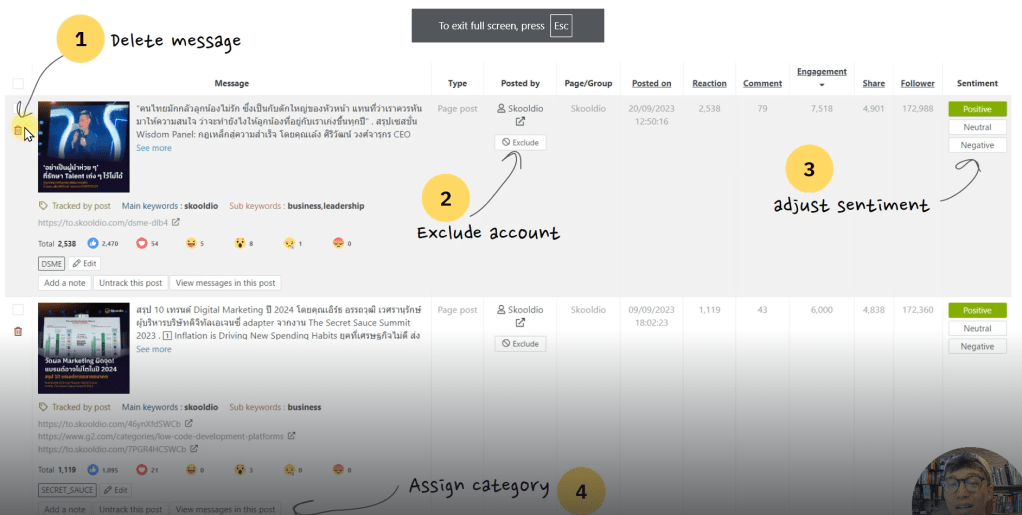
สามารถดูหน้าโพสต์นั้นผ่าน All channels skoodio Page ได้เลย
สามารถเปลี่ยน sub keyword หรือ message ที่จะหาได้ตลอดเลย
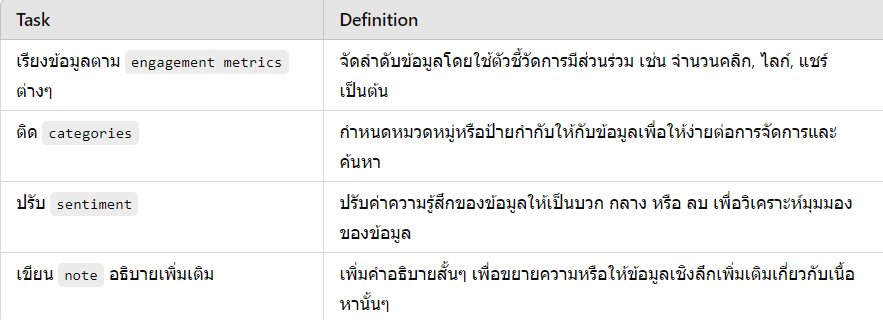
สามารถดู sentiment ได้ตรง top message engagement ได้เลย
รูปภาพจาก Social Listening — Data Analyst Edition by DataRockie
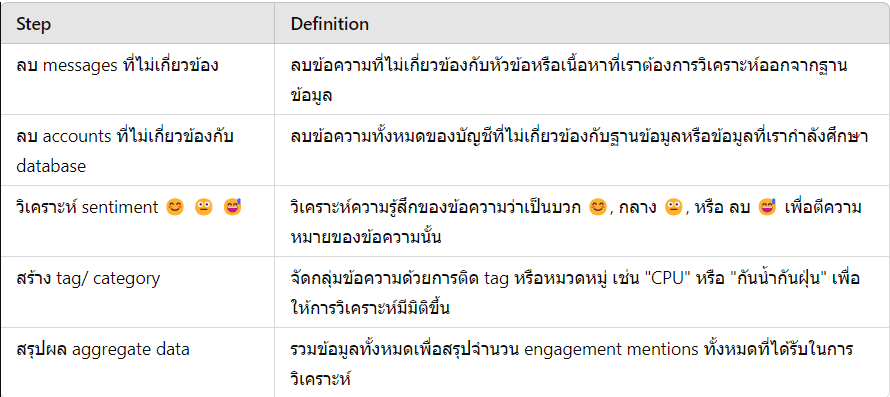
Do sentiment analysis for this “message” using options [“neutral”, “positive”, “negative”].
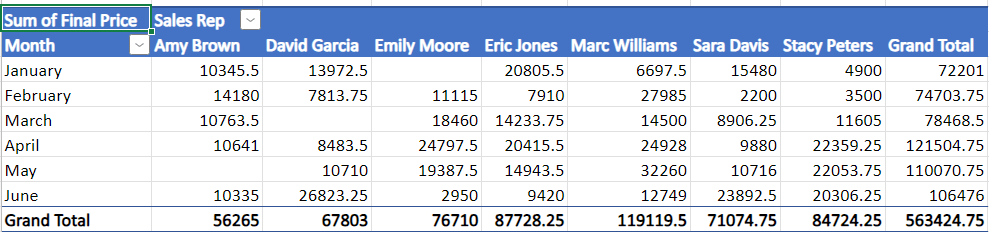
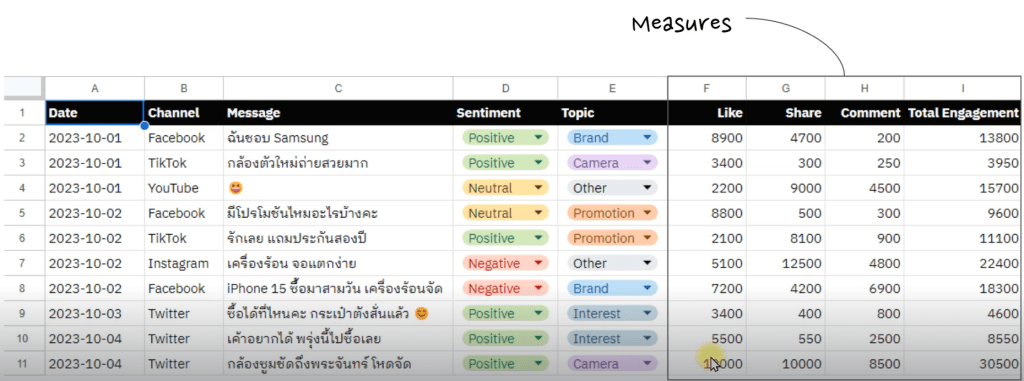
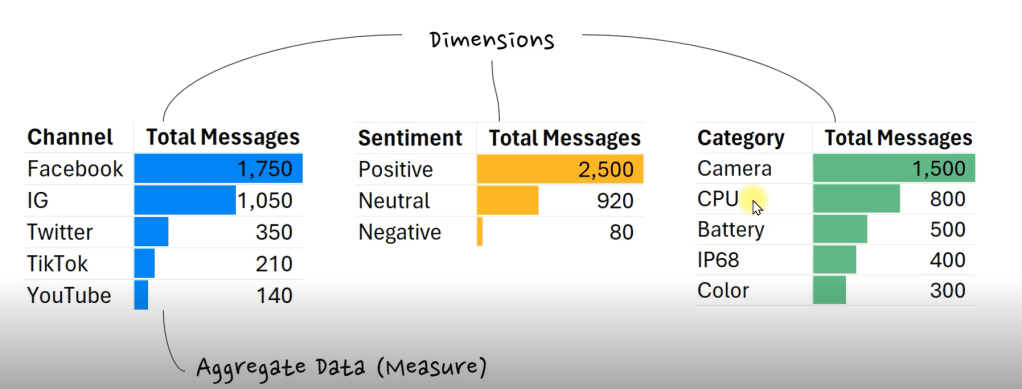
Aggregate Data
ก่อนที่เราจะเข้าสู่ Phase 3 [Present] ของโปรเจ็ค Social Listening เราจะทำการ Aggregate Data ให้อยู่ในรูปแบบ Table ที่เข้าใจง่ายๆก่อน
เครื่องมือที่เราใช้ทำ Aggregate Data ที่ง่ายที่สุดคือ Pivot Table ใน Excel/ Google Sheets หรือจะใช้ BI Tools ที่กำลังเป็นที่นิยมตอนนี้ เช่น Looker และ Power BI ก็ได้
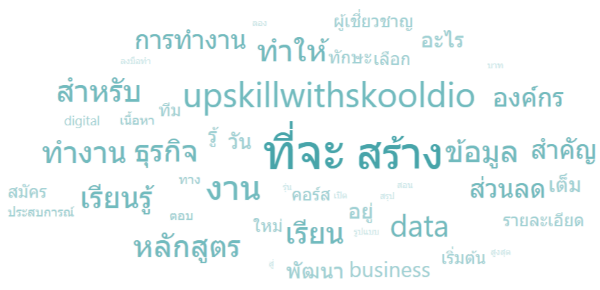
5. Word Cloud ใช้แสดงผลข้อความ phrase หรือ #hashtag ที่มีการ mentions เยอะๆในข้อมูล font size ยิ่งใหญ่ แปลว่ามีการพูดถึงคำนั้นเยอะ
Word Cloud สำหรับคำที่มีการพูดถึงเยอะ
Zocial Eye Dashboard มี common charts ทั้งหมดนี้ให้เราใช้งานได้เลย แต่ถ้าอยากจะ export data ออกมาทำเองแบบ manual ก็ได้เช่นกัน (หรือเอา raw data ไปขึ้น BI tools)
เราสามารถโหลดข้อมูลที่ได้จาก Social Listening Tools เข้า Business Intelligence (BI) Software เช่น Looker Studio, Power BI หรือ Tableau เพื่อทำ Report และ Dashboard เสนอผลวิเคราะห์
สำหรับ Program Google Looker Studio มีขั้นตอนดังนี้
Export file csv to looker studio
+ Blank Report page in looker studio
click to upload file
add to report
แล้วสามารถใส่ chart ตามใจชอบ
Sample Looker Studio
Slide Making
ทีม Data Analyst ใช้ Slide Presentation ในการนำเสนอ Insights ที่น่าสนใจ
Software ที่เราใช้ทำ Slide Presentation เช่น
PowerPoint (Windows)
Keynote (Mac OS)
Google Slides (Web-Based)
Canva (Web-Based)
Tip – หลายคนอาจจะไม่รู้ แต่ Slide Making คืออีกหนึ่งทักษะสำคัญของการเป็น Data Analyst ที่ดีเลย หรือที่เราเรียกกันว่า Communication Skill (ใน Job Description/ Requirement)
Slide Making
Limitations of Social Listening Data
ข้อจำกัดของข้อมูล Social Listening ที่เราเก็บเข้ามาในระบบ
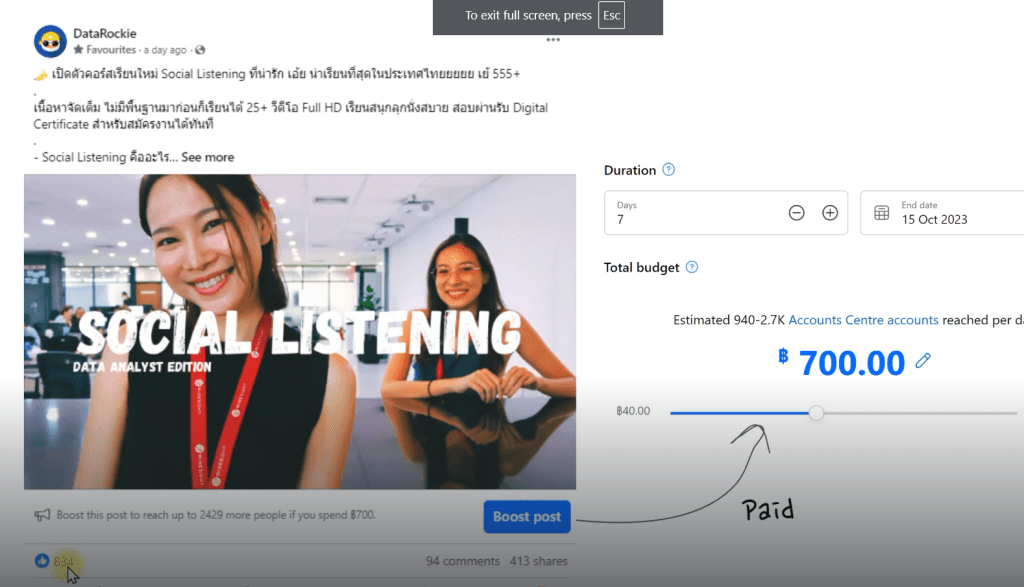
เราไม่สามารถแยกระหว่าง Organic vs. Paid ได้ นอกจากเราจะเป็นเจ้าของ Page/ Channel นั้นๆถึงจะรู้ว่าโพสต์ไหนบ้างใช้เงินอัดโฆษณา
Boost post
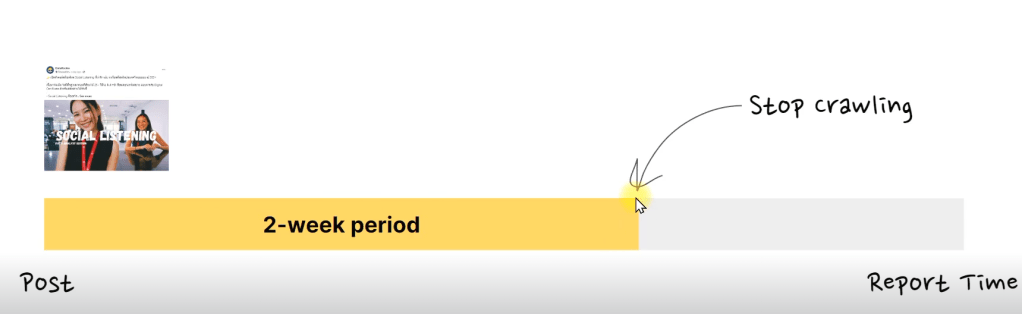
เรื่องการ Update ระบบ Social Listening จะมีรอบในการวิ่งกลับไปเก็บข้อมูลล่าสุด เช่น Post วันที่ 1 ก.ย. 2023 จะมีการวิ่งกลับไปเก็บอีกสองครั้งวันที่ 8 และ 15 ก.ย. 2023 หลังจากนั้น ระบบจะหยุดเก็บข้อมูลแล้ว ทำให้ตัวเลขบน Social Media กับใน Report อาจจะไม่ตรงกันเป๊ะ 100%
Social Media Inaccuracy
Social media platforms บางตัวยังไม่เปิดให้ใช้งาน Public API เช่น TikTok (อัพเดท ต.ค. 2023) หรือมี API ให้ใช้ แต่ไม่ส่งค่าบางอย่างกลับมาเช่น Facebook API ยังไม่แชร์ค่า Video Views บน Page กลับมาให้เราวิเคราะห์ต่อ ต้องไปดึงแบบ manual เอง
3. Talk about what you’re writing – เล่าให้คนอื่นฟังว่าเรากำลังเขียนอะไรอยู่ เพราะ “Knowledge is conversational” เพื่อนๆรอบตัวเราอาจมี Insights ที่ช่วยให้เราเขียนเรื่องนั้นดีขึ้นก็ได้
5. Do writing exercises – ฝึกเขียนด้วยเทคนิค ”Free Writing” คิดค้นโดย Peter Elbow ในปี 1973 เป็นการเขียนที่ปลดล็อคความคิด ไม่มีข้อจำกัดใดๆ เหมือนการ ”Warm Up” ก่อนเขียนงานหลักของเรา
6. Organize your material – รวบรวมและจัดเรียงข้อมูลเพื่อสร้าง Story ที่เราอยากเล่า Gary แนะนำ “ให้เก็บมากกว่าที่เราจำเป็นต้องใช้” ยิ่งมี Input มากเท่าไหร่ เรายิ่งเขียนได้ง่ายขึ้นเท่านั้น
7. Make a list – เขียนลิสต์สิ่งสำคัญที่เราอยากจะ Cover ในบทความ สร้าง Outline ง่ายๆ เช่น สิ่งที่เราอยากให้ผู้อ่านได้รับ Key Message, Questions และ Takeaways
8. Picture a reader – นึกถึงหน้าผู้อ่านอยู่ตลอดเวลา นึกภาพเค้านั่งอ่านอยู่ข้างเรา อย่าใช้คำศัพท์ที่ทำให้เค้าหันมาถามเราว่า “ประโยคเมื่อกี้แปลว่าอะไร”
9. Ask yourself why – ถ้าเราตอบไม่ได้ว่าเราจะเขียนงานนั้นไปเพื่ออะไร อย่าเสียเวลาเขียนเลย ทุกงานเขียนต้องมีหนึ่ง “Job to be done” เสมอ เช่น ทำให้คนหัวเราะ ซื้อของ ร้องไห้ หรือได้ความรู้ ฯลฯ
On Writing Well ของ อ. William Zinsser คือที่สุด เรียกว่าระดับตำนานของแทร่ เขียนยังไง สไตล์ไหน ให้เข้าถึงใจผู้อ่าน เป็นเล่มที่คิดว่าต้องอ่านๆซ้ำ จะดีมากถ้าได้อ่านทุกปี
วิธีการเริ่มเขียนเบื้องต้นก็สามารถเริ่มได้จากการฝึกเขียนส่วนตัว แบบ Short form , Long form เปิดเว็บไซต์
My Personal Workflow
ใช้ database table เป็นอุปกรณ์พิเศษที่ช่วยในการจัดการว่ามี list อะไรสำคัญบ้าง เช่น Episode, Date, Tag, Content, URL, Status
การมีอุปกรณ์ที่ดีในการช่วยเขียน สามารถช่วยให้เราเขียนงานได้ดีขึ้นหลายเท่า เช่น Notion เป็น software หลักในการสร้าง digital second brain ประยุกต์ใช้ CODE method รัวๆ
Type
Definition
Episode
ตอนที่, บทที่
Date
วันที่
Tag
ประเภทของบทความ
Content
ชื่อบทความหรือหนังสือ
URL
link หนังสือหรือเว็บไซต์
Statue
สถานะว่าทำเสร็จหรือยัง
A Very Normal Daily Routine
ตารางชีวิตแอดทอยจะประมาณนี้ๆ มีคลาดเคลื่อนบ้างนิดหน่อย Cheat Day 555+