# Load the latest version
df = kagglehub.load_dataset(
  KaggleDatasetAdapter.PANDAS,
  "bravehart101/sample-supermarket-dataset",
  file_path,
  # Provide any additional arguments like
  # sql_query or pandas_kwargs. See the
  # documenation for more information:
  # https://github.com/Kaggle/kagglehub/blob/main/README.md#kaggledatasetadapterpandas
)
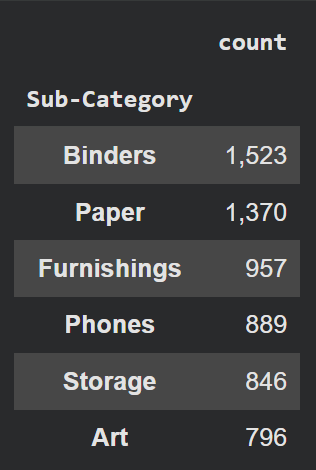
## Sub-Category that make company Loss the most is.
the_most_loss = df.groupby("Sub-Category")['Profit'].sum().sort_values(ascending=True).head()
print(the_most_loss)
รัฐไหน (State) ที่เรามียอดขายเยอะ (Top 10) แต่กำไรกลับติดลบ? (ยอดขายหลอกตาให้รู้สึกว่า Sale เยอะ!)
## the most state most sale but profit less
the_most_state = df.groupby("State")[['Profit','Sales']].sum().sort_values(by='Profit', ascending=True)
print(the_most_state)
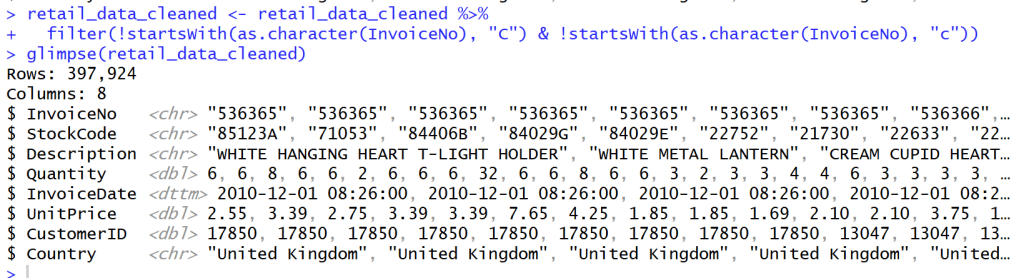
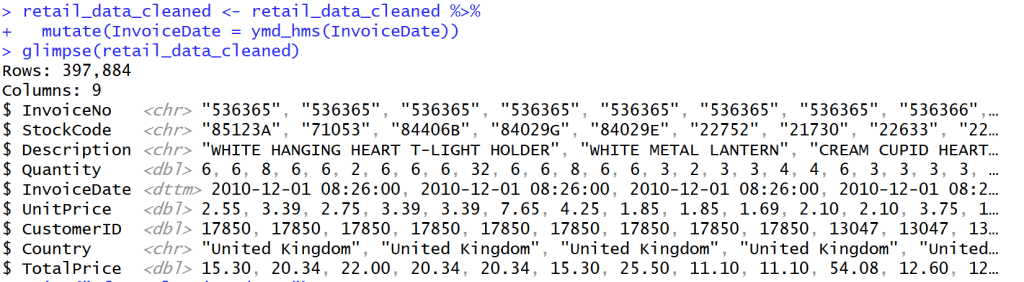
เราจึงต้องกรอง Invoice ที่ขึ้นต้นด้วย C และ c ออกไปเพื่อเหลือแค่ลูกค้าที่สั่ง Order กับเราจริงๆ โดยไม่ยกเลิก Order
## Cancel transaction that have C before Invoice NO.
retail_data_cleaned <- retail_data_cleaned %>%
  filter(!startsWith(as.character(InvoiceNo), "C") & !startsWith(as.character(InvoiceNo), "c"))
glimpse(retail_data_cleaned)
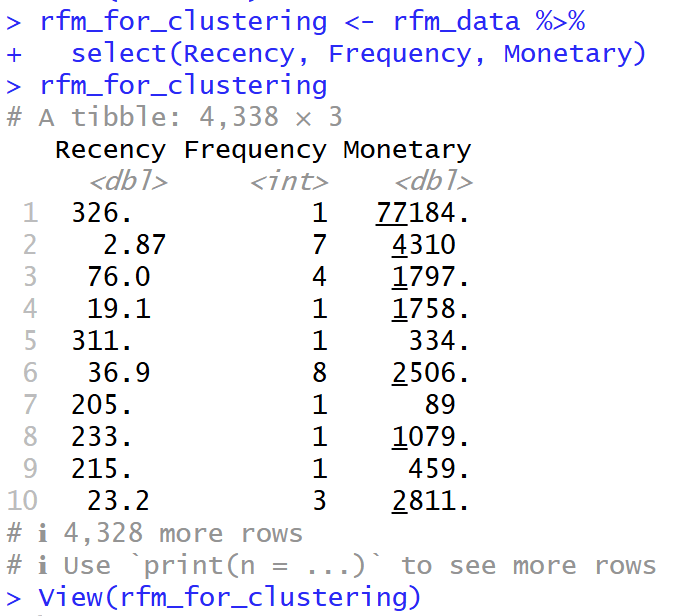
## Standardize
## make average to be 0 and S.e. to be 1
rfm_scaled <- scale(rfm_log)
print("Adapt with propotion:")
print(head(rfm_scaled))

View(rfm_scaled)
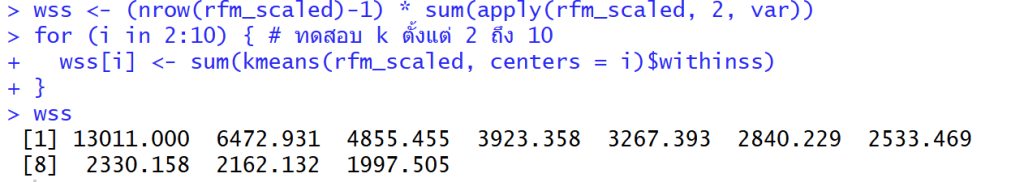
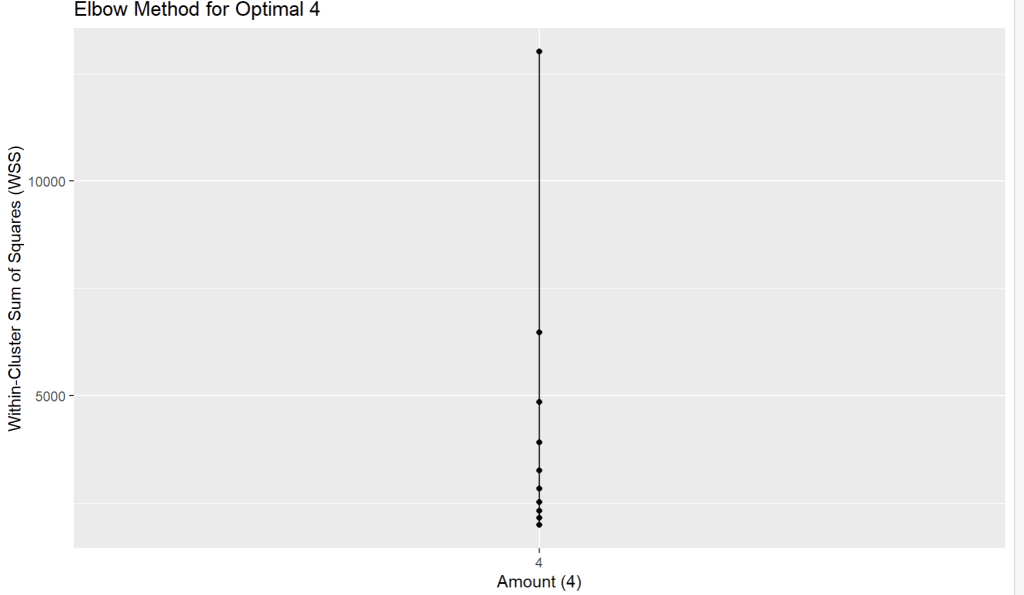
## Elbow method to find K that fit to data
wss <- (nrow(rfm_scaled)-1) * sum(apply(rfm_scaled, 2, var))
for (i in 2:10) { # ทดสอบ k ตั้งแต่ 2 ถึง 10
  wss[i] <- sum(kmeans(rfm_scaled, centers = i)$withinss)
}
wss
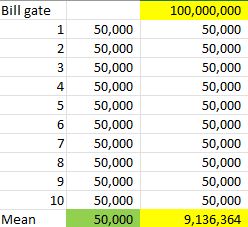
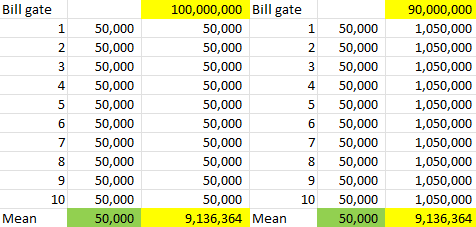
หากจะเลือก Sample Size สุ่มให้ดี ควรเลือกกลุ่มที่มีความใกล้เคียง Population เช่นเลือกคนที่เป็นคนตอบแบบสอบถามให้ใกล้เคียง Population เช่น Sampling ควรมีผู้หญิง และผู้ชายเท่ากับ Population
Sampling ที่สุ่มมาได้ผู้ชาย 20% ซึ่งไม่ตรงกับ Population ซึ่งทำให้ใช้จริงได้ยาก
Cautions
ทำให้ Sample ไม่สามารถ Represent กับ Population ที่เกิดขึ้นจริงได้
This project explores the use of Power BI to create dashboards that provide insights for improved business planning and decision-making within organizations. It also demonstrates how structured data can be presented in a clear and accessible manner through data storytelling.
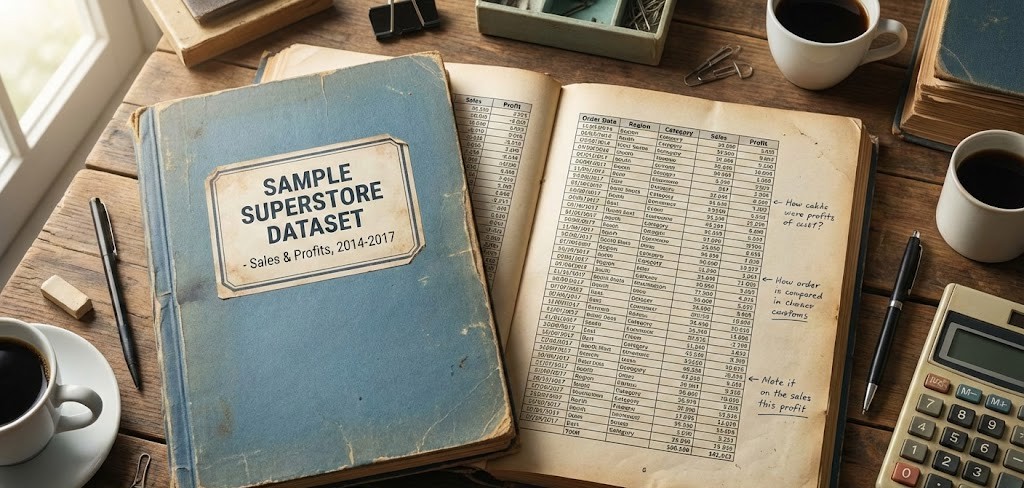
This data file is for Emma’s coffee shop capstone task that use to create reports have 5 sheets.
Sheet 1, named “Orders” contains the following data:
Order ID : Show the order list of Coffee shop
Customer ID :Show the customer sequence connected to the ‘Customer ID’ sheet.
Product ID : Show the product sequence linked to the ‘Customer ID’ sheet.
Quantity : The quantity of coffee.
Unit Price : The price of coffee per unit.
Order date : The date of the coffee sale.
Sheet 2, named “Feedback” displays the following data:
Feedback ID : Order of displaying customer feedback and suggestions.
Customer ID : Show the customer order based on the “Orders” sheet.
Rating : Coffee Rating
Feedback : Text displaying customer feedback.
Feedback date : Date of coffee shop reviews.
Sheet 3, named “Inventory” displays the following data:
Product ID : Show the product sequence from the “Orders” sheet.
Stock Level : Stock levels of coffee
Reorder Level : The stock level at which a new order should be placed.
Supplier : Who buys products for another person.
Sheet 4, named “Customers ID” displays the following data:
Customer ID : Show the customer list connected to the “Orders” sheet.
Customer Name : Customer’s name of Coffee Shop.
Email : Email of customer’s Coffee Shop.
Sheet 5, named “Product ID” displays the following data:
Product ID : Show the product list connected to the “Orders” sheet.
Product Name : Name of product in Coffee shop.
Category : Category of product in Coffee shop.
Price : Price of product in Coffee shop.
Navigate the power BI interface and import data
Understand the basics of spreadsheets.
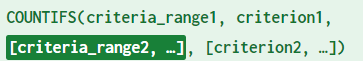
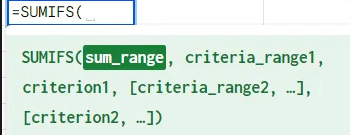
Familiarity with data cleaning and IF/SUM functions in spreadsheets is required.
The Microsoft account used to publish reports to Power BI.
Learning Objective
Explore additional Power BI features like filtering publishing and graphs customization.
Build report with visualizations
Manage data relations and transform data with power Query
you could build a data model and start to build some visuals and add some filters to our data. Then, we’ll look on how to add a theme and share your report and dashboards with others.
Your Role : Data Analyst
You are a Data Analyst for Cookie Bliss, your mission is to create a Power BI report to help visualize key metrics more effienctly and then publish the dashboard to share it with your teammates, providing them with sales insights for better decision-making
Start Power BI
Then, open Power BI.
Blank Report
Then, Choose Blank Report
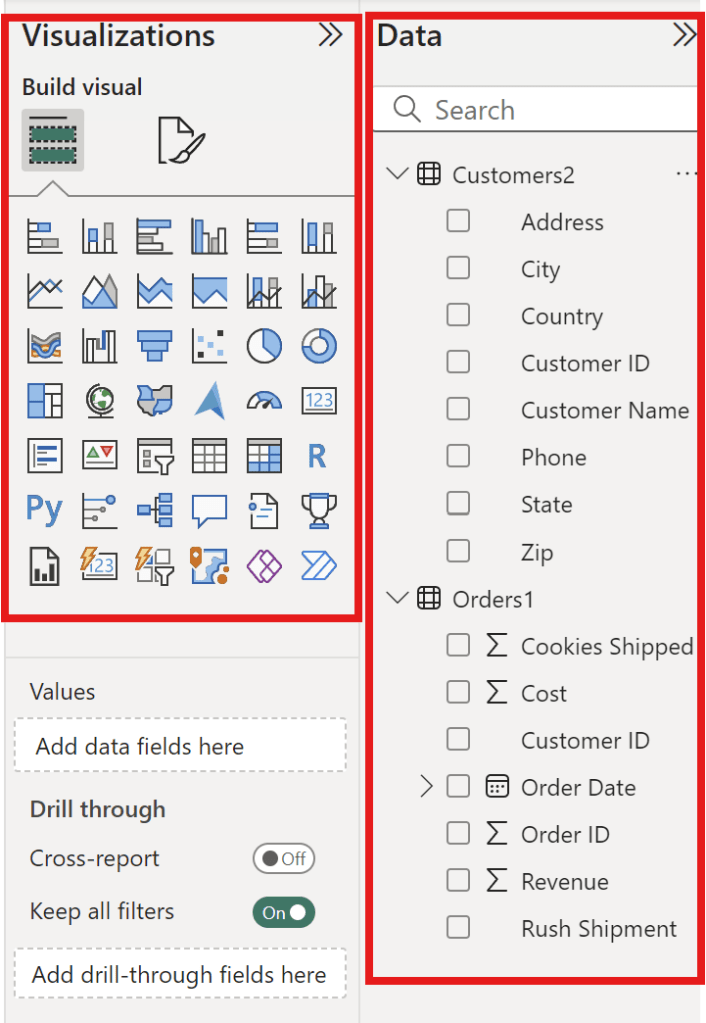
Visualizations Pane
The side column of this table highlighted in red above the picture has four rows call “Visualizations Pane“.
Visualizations PaneType
Definition
Report View
The Dashboard Report
Table View
Dataset Details
Model View
Data Relationship Model
DAX Query View
DAX Query Editor
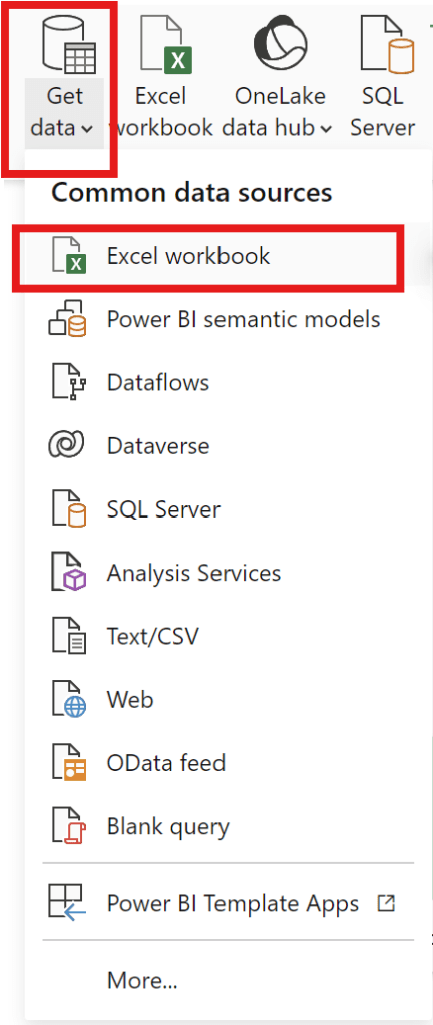
To create a dashboard, data must be selected.
Get Data –>Excel Workbook –>Select the file you want to use to create a dashboard.
Get Data
start from export file “data“
and can add data can be exported from various common data sources.
–> Choose file “data”
–> Choose Customer2 table and Order1 table then click load.
Load Data
Transform data using Power Query
how to transform data before starting to build our report.
can check the Data and Visualization areas.
Check Data and Visualization Zone
Picture above show the Data and Visualization areas to see how each data element should be displayed.
Transform dataprocess
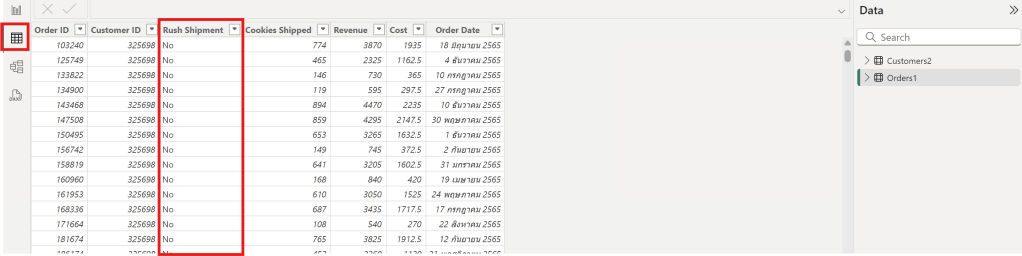
Let’s start in the Table view.
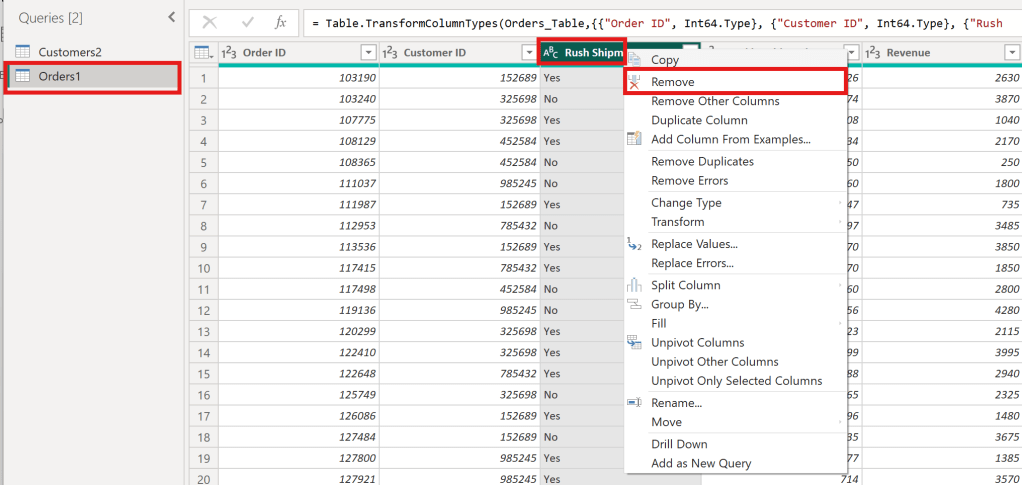
In the Table view, the Rush Shipment column appears to be unnecessary from Order1 Table
Rush Shipment Column
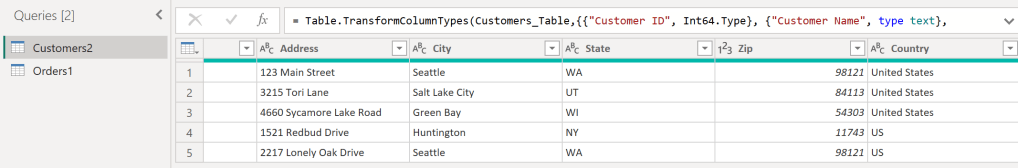
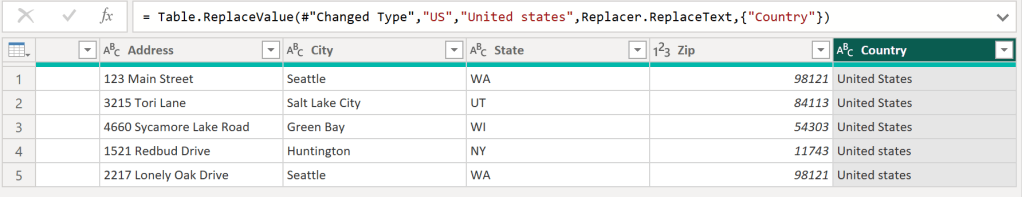
2. In the Table view, the Customer2 table has a column with both “United States” and “US” as values, which should be standardized to one name.
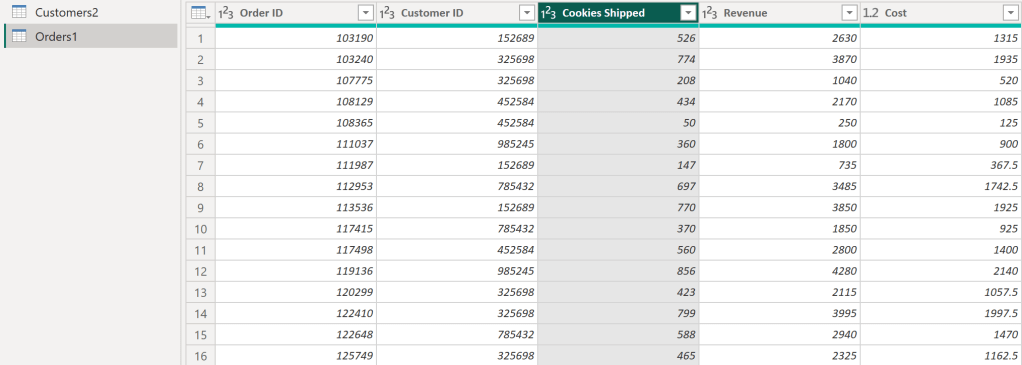
After following the steps in the image, It will get the desired columns as follows:
The Rush Shipment column has been removed.
Rush Shipment column has been removed
Then, clicking “Close & Apply” will result in a cleaned data table.
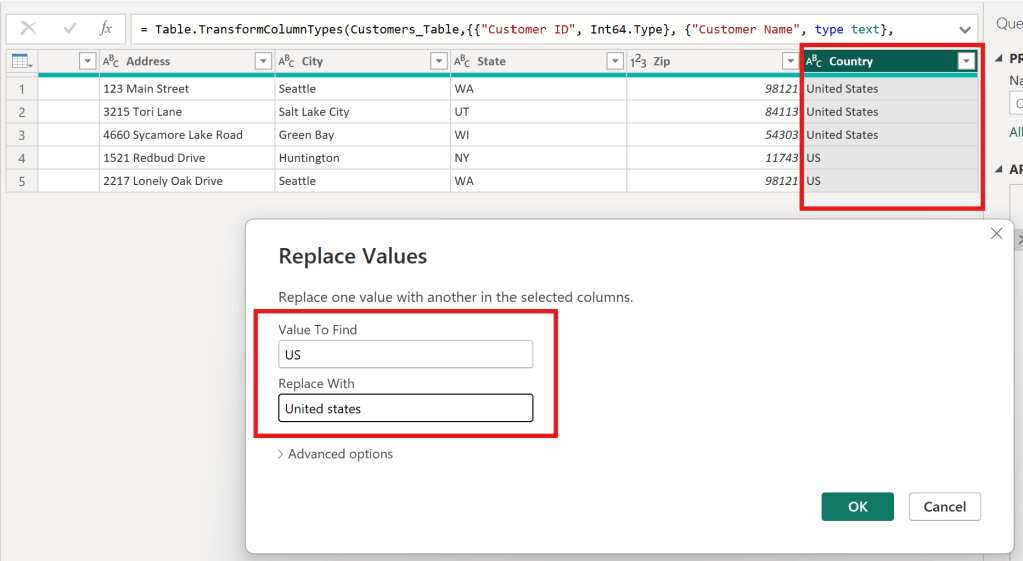
Replace Value
Click Transform Data to Replace values.
Transform Data to replace values.
In the Customer 2 table, replace all “US” values in the Country column with “United States.” and then click OK
to change US to be United States
As a result, Country column successfully replaced value as below.
successfully replaced value
Insert and format a visualization
learn how to visualize data from multiple tables and customize graph formatting options.
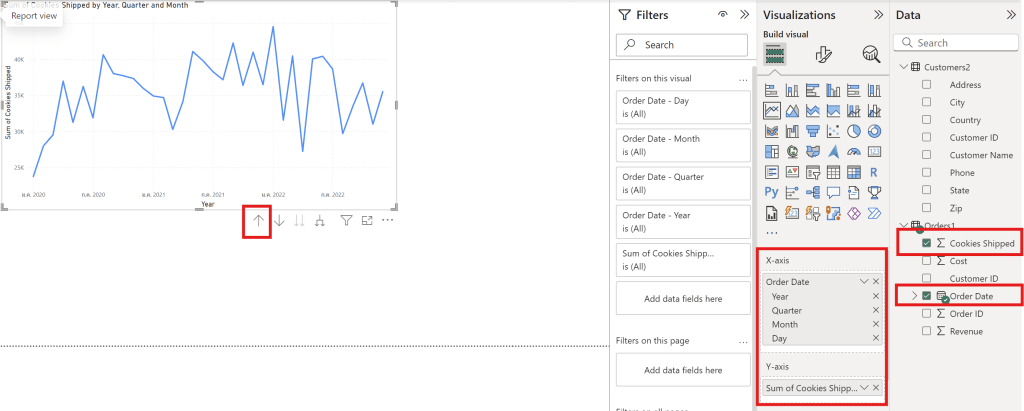
create a line chart.
Use the up arrow to change the data scale (day, month, and year)
Axis
Column of Data File
Y-axis
Sum Cookies shipped
X-axis
Order Date
Line Chart
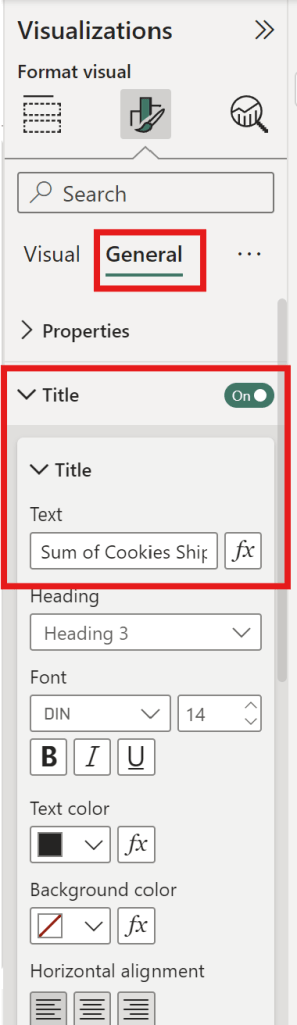
Visual
can adjust the visual appearance of the data through the following Visual Format options.
Visual
can edit Values.
can choose Data label to show number in graph.
General
can adjust the font size.
can adjust the graph’s position.
can adjust the graph’s color.
can change the title.
General
Practice Data Visualization in Power BI
You are a data analyst working with a chocolate factory and would like to help them visualize their data.
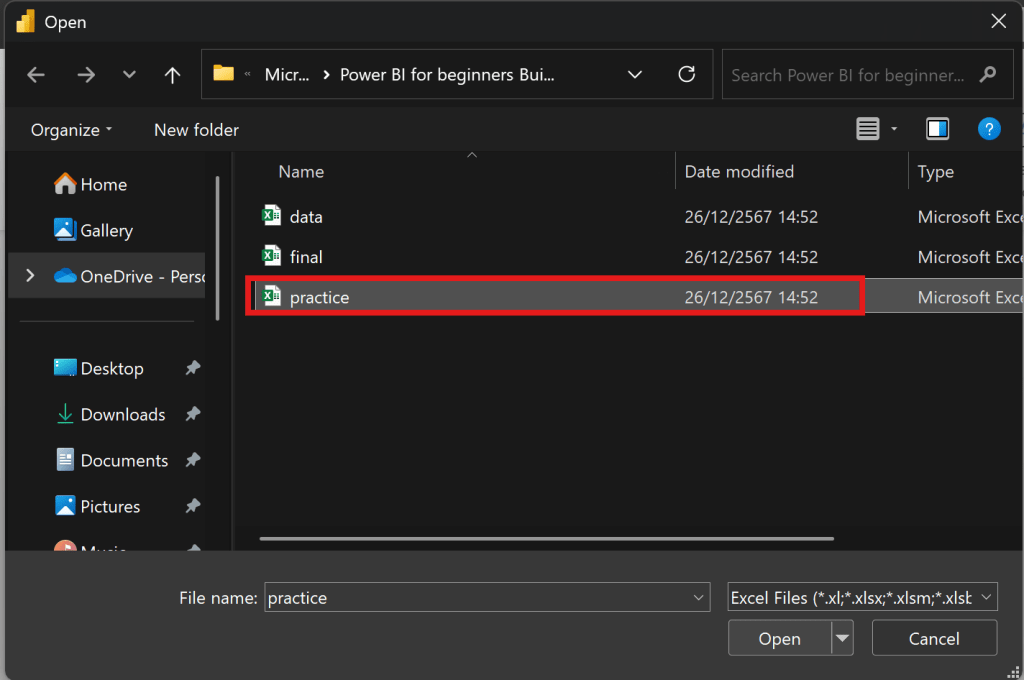
The data is presented in the readings under “practice.xlsx” You need to import this data to Power BI, do the necessary transformation and data cleaning using Power Queries and then build the relationship betweendiffrerent columns. Finally, I need you to create a line chart that shows the evolution of sales over time.
start from export file “practice“
export file “practice“
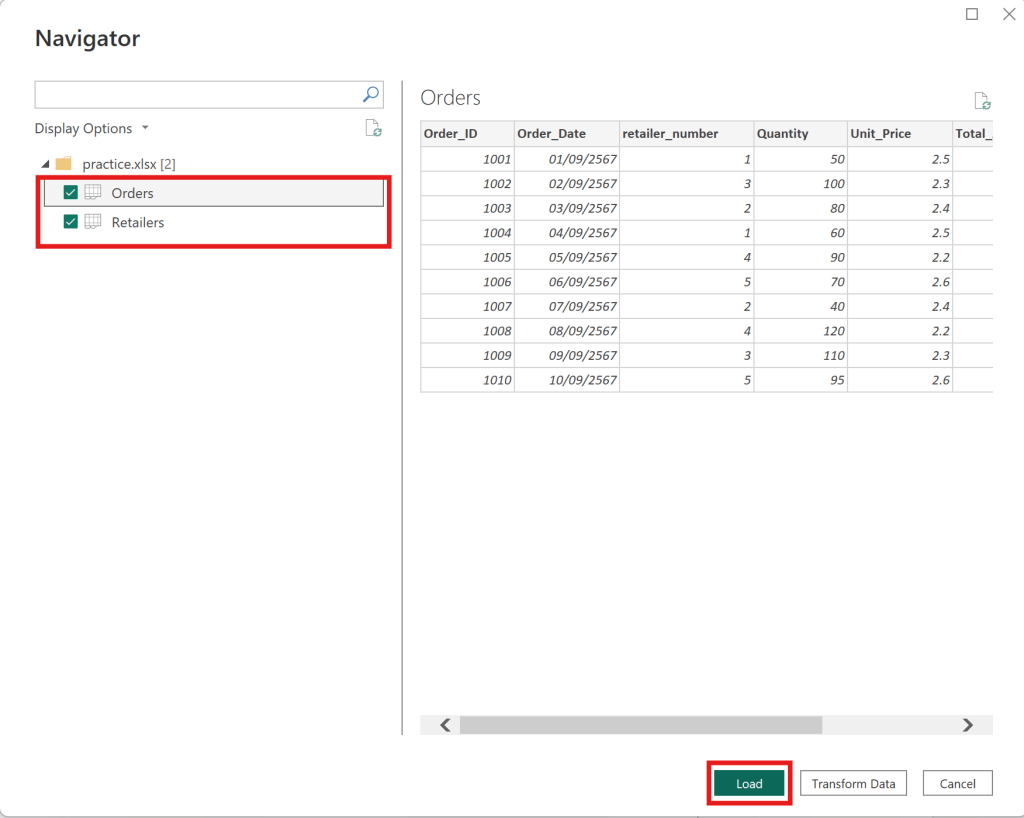
upload Orders table and Retailer table —> click load as below
Orders table and Retailer table
Choose the Retailer Table to use Replace Value.
Change “UK” to “United Kingdom“.
Change “UK” to “United Kingdom”.
Then close and apply, and return to the dashboard.
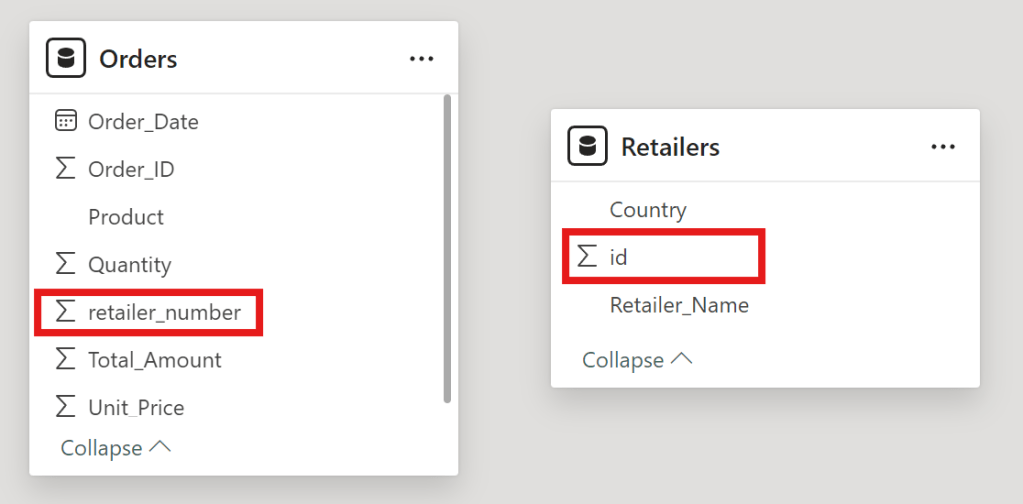
Relationship
To create a relationship between orders and retailers in Power BI
relationship between orders and retailers.
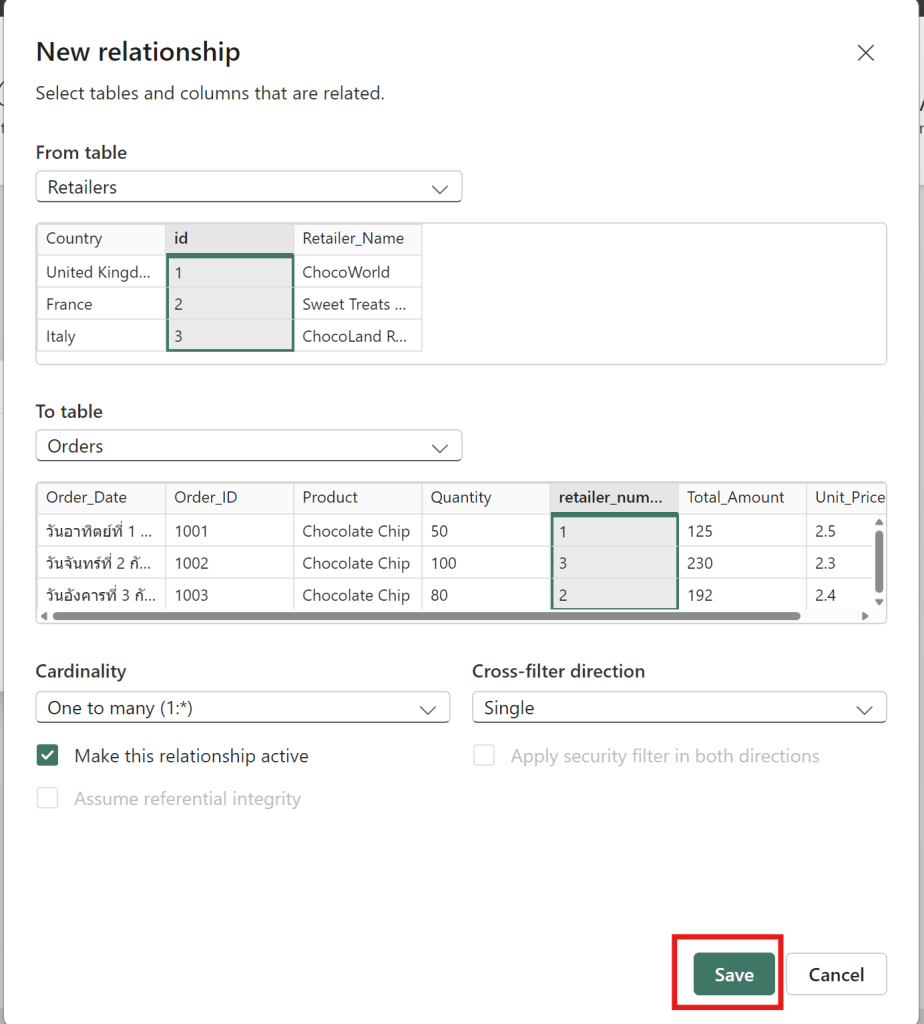
drag id to retailer_number
then click save to connect new relationship between Retailers id and Order retailer number
connect between Retailers id and Order retailer number
Now that the data is cleaned and the relationship is created.
to create Line Chart between Order_date and Quantity
Line Chart between Retailers id and Order retailer number
then click line chart
Axis
Column Data Files
X-Axis
Order date by day
Y-Axis
Quantity
Now I can see the data by day of the quantity of chocolate bars sold. Now that you have a better handle of importing and preparing data into PowerBI and inserting your first visual.
Add more visuals to enhance storytelling
show how to add additional graphs and pages to a report, as well as explore filtering options using maps, tables and bar graph.
Card Chart
to show the total revenue that we earned here at the Cookie Bliss.
how to create card chart
Choose card
Choose fields as sum of revenue of Orders1 Table.
card chart with revenue
then it show revenue value
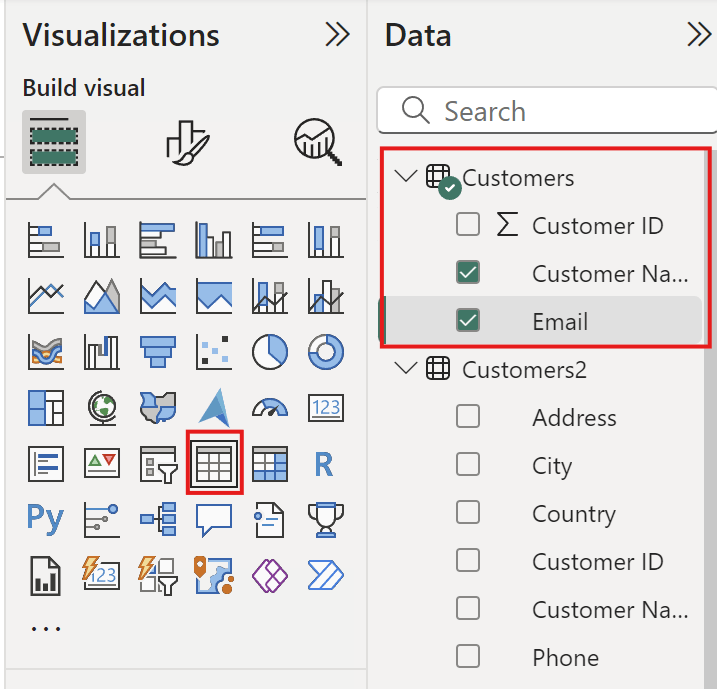
Table
Show table of customer name
customer name
Drag Customer name column then it show table of customer name.
Customer name Table
Then it can show the interaction between Customer Name and Revenue value on the dashboard.
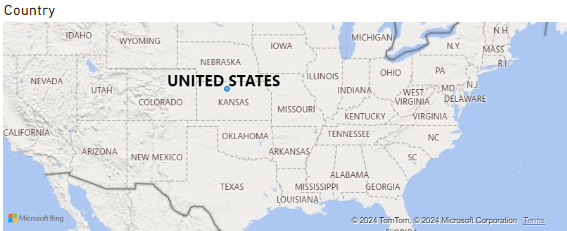
Map
Choose map and then select country column
then it show maps of country
Map
Publish the report to the Power BI workspace
then can change theme of dashboard by this theme.
Change theme
add the customer id and the phone number is good choice
customer id and phone number
then add this title name as “Cookie Bliss Sales dashboard”
Cookie Bliss Sales dashboard
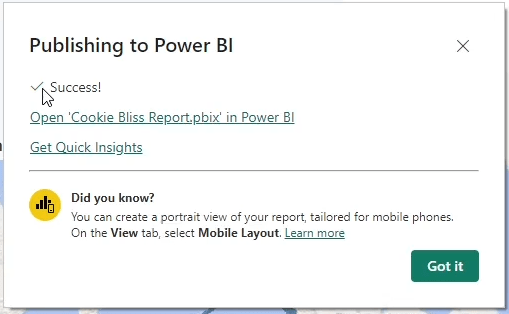
publish to Power BI —> My workspace
When it have success It finish publish Power BI
Publish Power BI
Cumulative Activity Scenario
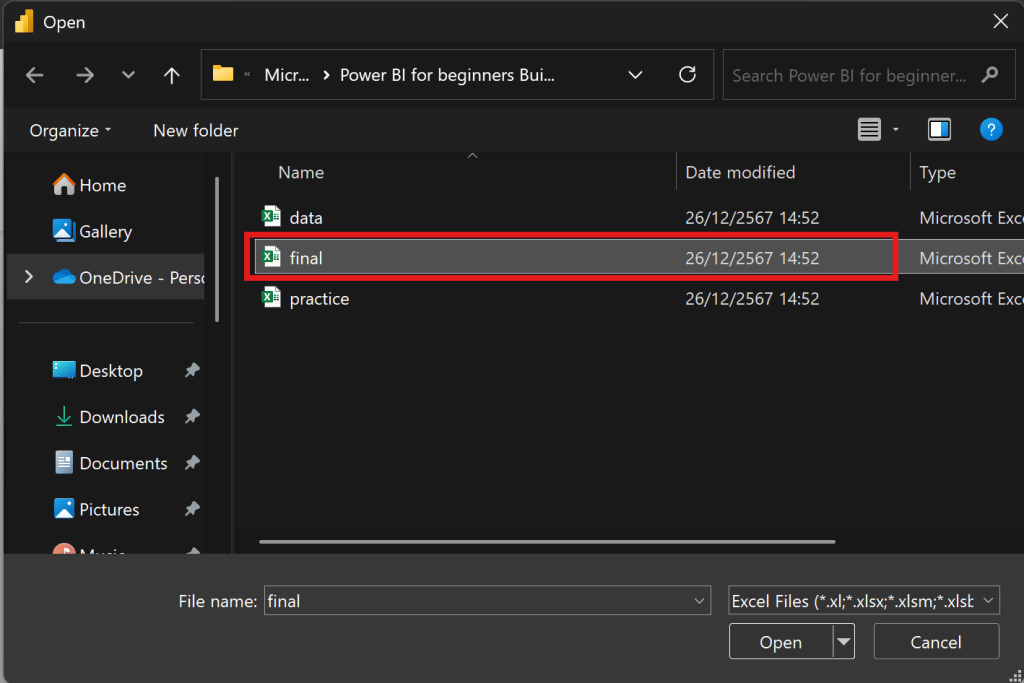
then get data final files to upload and do visualization
Choose Final File
then choose all 5 tables Customers, Feedback, Inventory, Orders and Products
Products
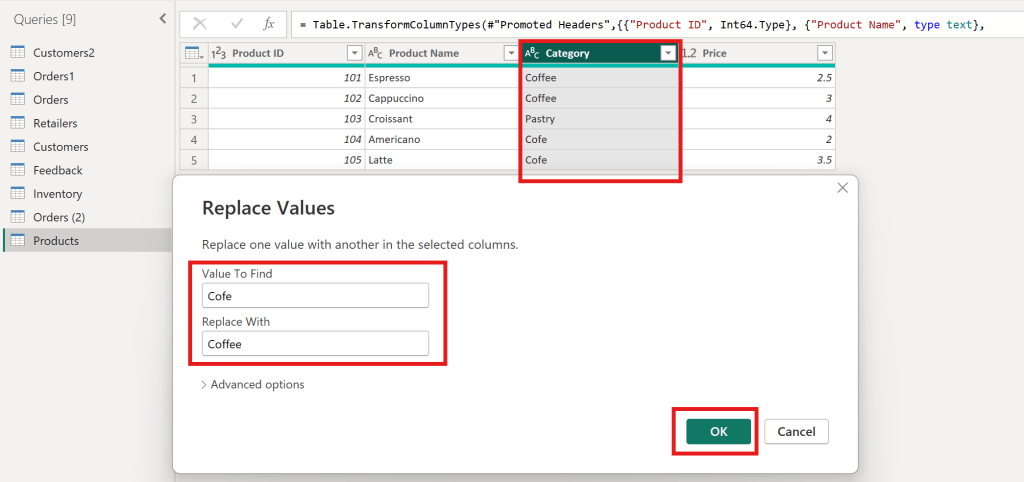
In Product table must clean data first
Replace Value Product table
Value to find “Cofe” replace with “Coffee”
to make category have Coffee and Pastry
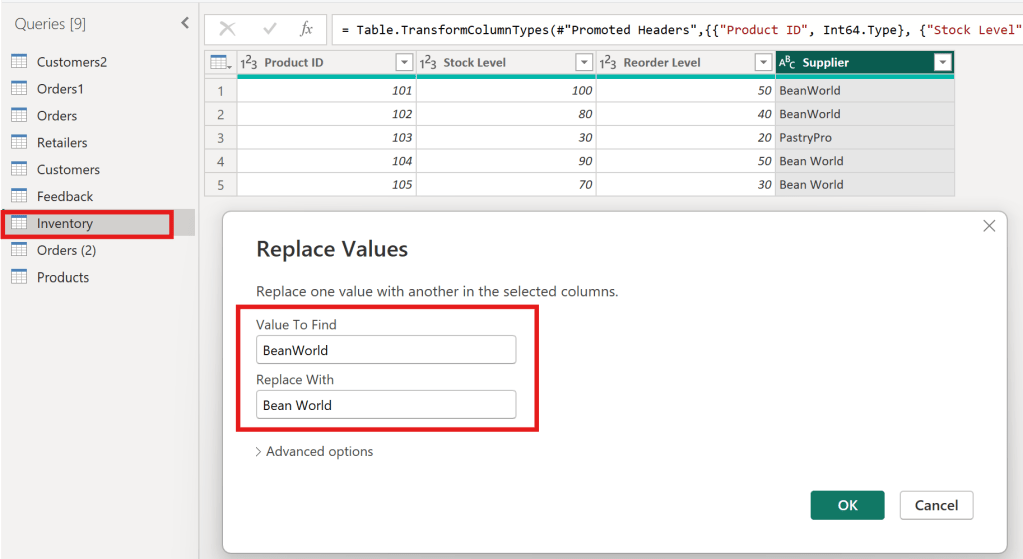
Inventory
In Inventory table must clean data first
Replace Value Inventory table
Value to find “BeanWorld” replace with “Bean World”
to make supplier have BeanWorld and PastryPro
Create Sales reports
Create Title Sales Report
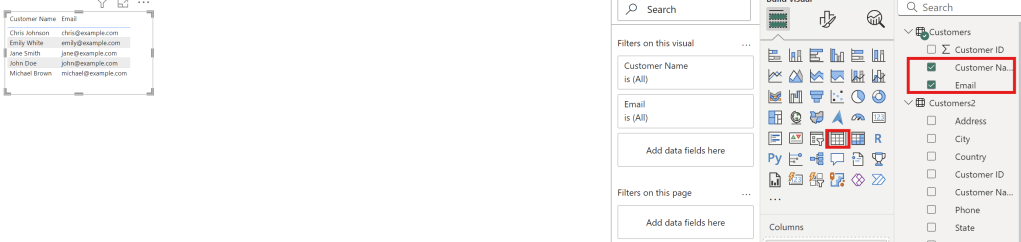
Create Table
Create table in Sale Report
Select Customer name and Email to create table
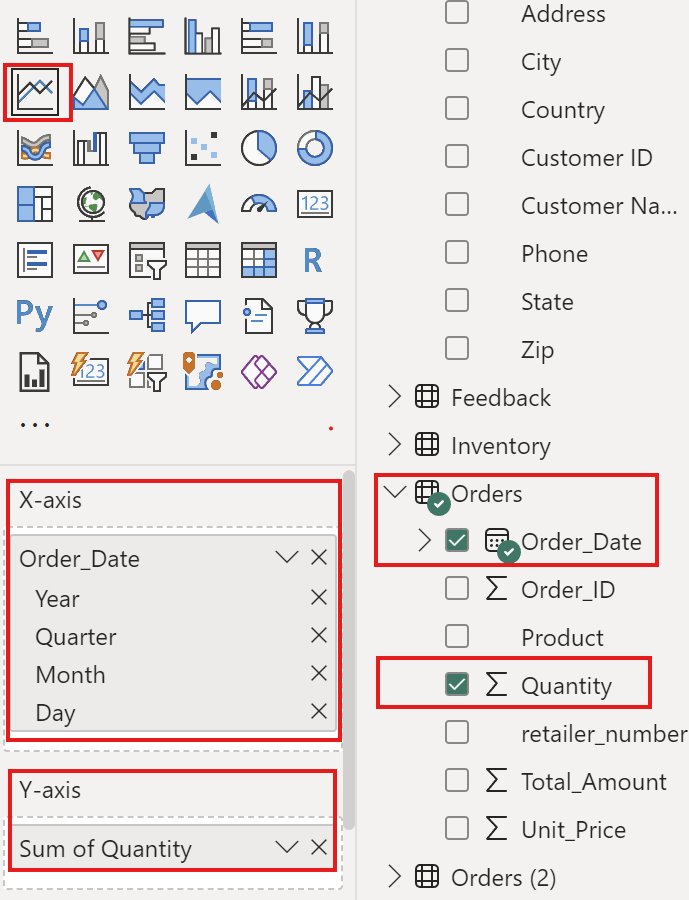
Create line chart
Create line chart with order date and Quantity
Axis
Column Final Files
X-Axis
Order Date
Y-Axis
Quantity
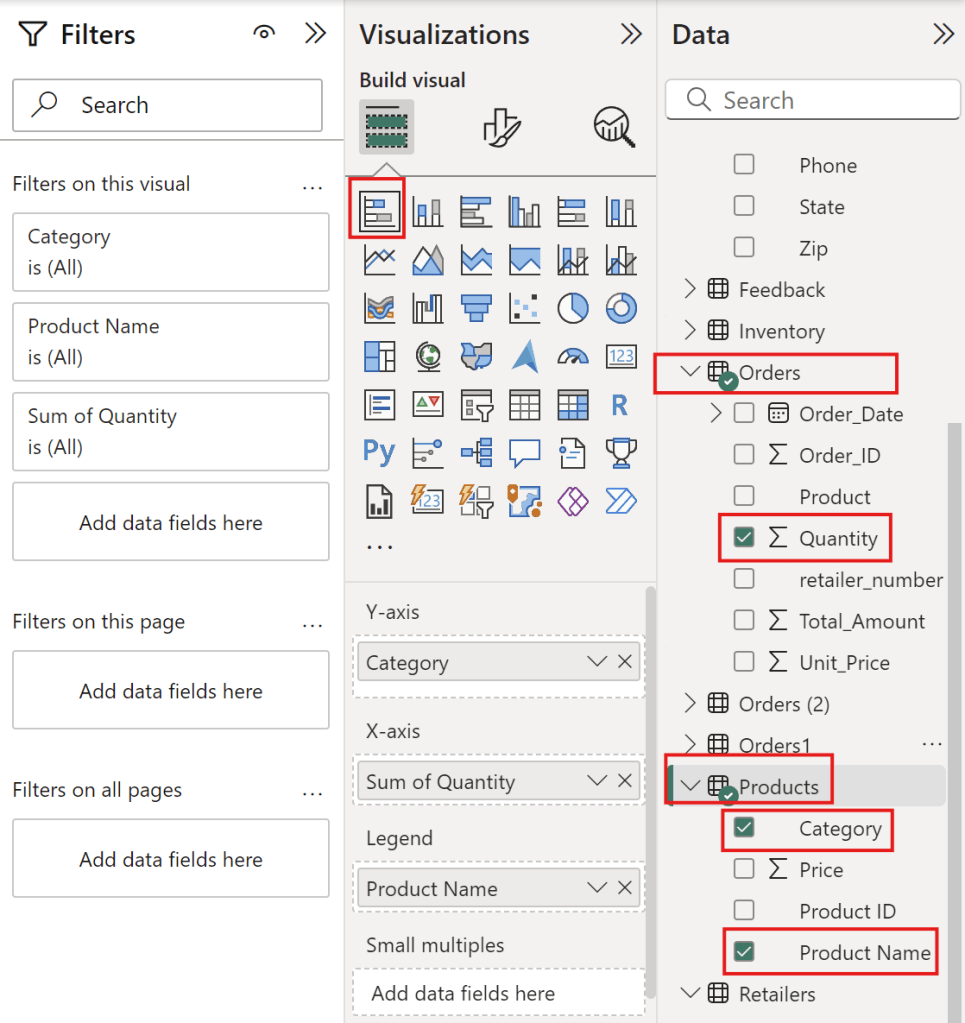
Create stacked bar chart
Create stack bar chart with Category, Product Name and Quantity
Type
Column Final Files
Y-Axis
Category
X-Axis
Sum of Quantity
Legend
Product Name
to see coffee that people love eat it.
Full Sale Report
Sale Report
Create management reports
Create Title as management reports
Create card of average rating
card of management report
Select Feedback table with Rating column and value with average of rating.
Create table with customer name and emails
table with customer name and emails
Select Column as customer name and Email
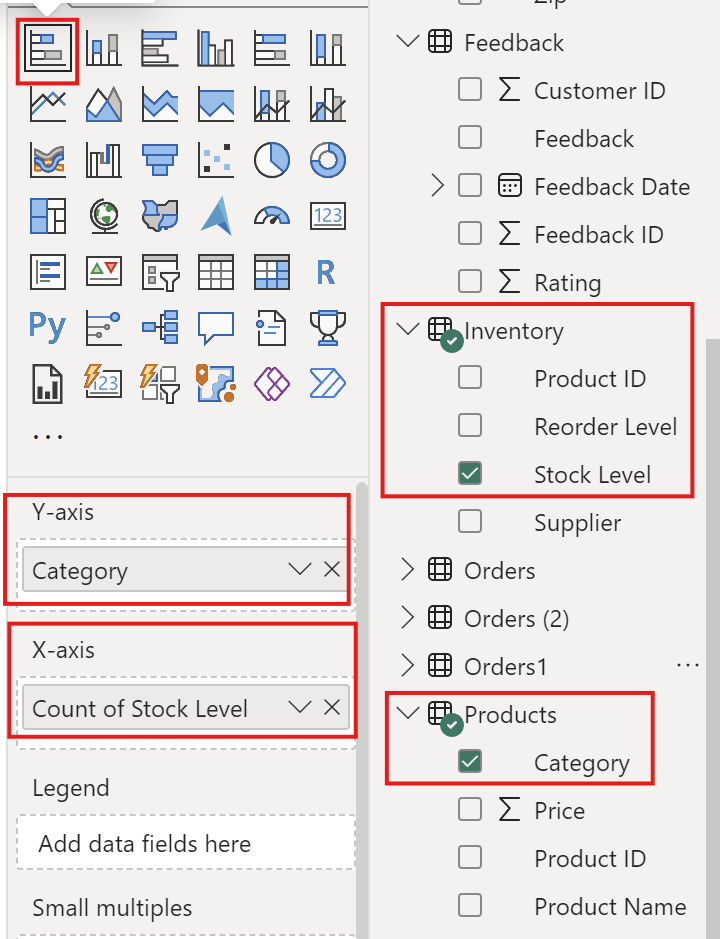
Create stack bar chart
Create stack bar chart with category and Stock level
Axis
Column Final Files
Y-Axis
Category
X-Axis
Stock Level
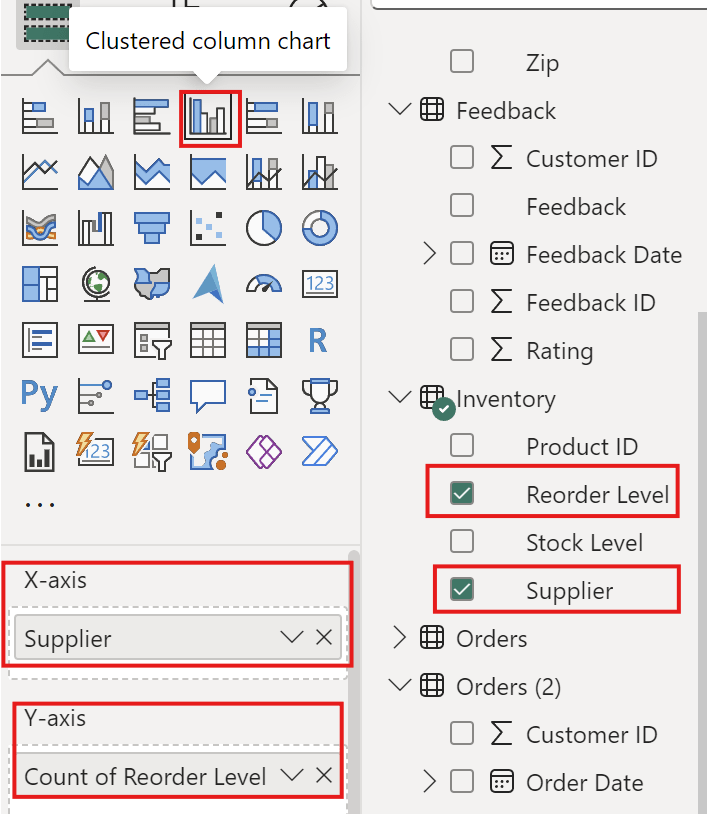
Create clustered column chart
clustered column chart with Reorder Level and Supplier
Axis
ColumnFinal Files
Y-Axis
Count of Reorder level
X-Axis
Supplier
Full Management Reports
Management Report
Summary
I hope this project helps users create dashboards in Power BI, improve their proficiency with the tool, and learn effective techniques for using titles, colors, and themes.
SQL (Structured Query Language) is a powerful programming language used for managing and manipulating relational databases. It allows users to create, retrieve, update, and delete data efficiently within a database system. SQL is widely used across industries for tasks ranging from data analysis to database management.
A relational database is a type of database that organizes data into structured tables (relations) with rows and columns.
Database
purpose of introduction with SQL
Understand databases and their structure
Extract Information from databases using SQL
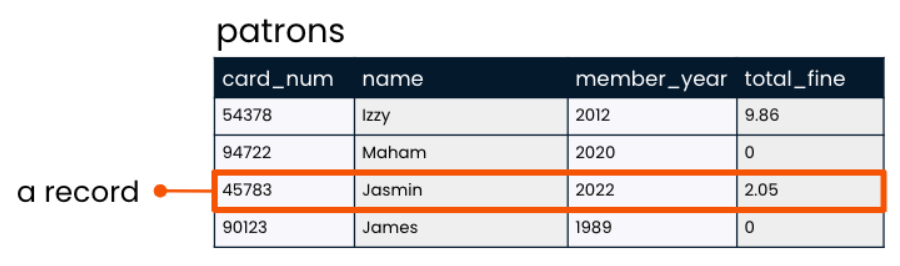
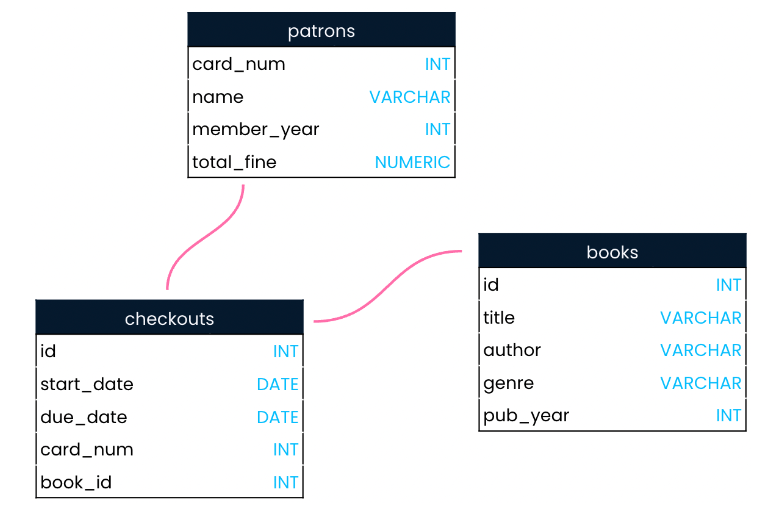
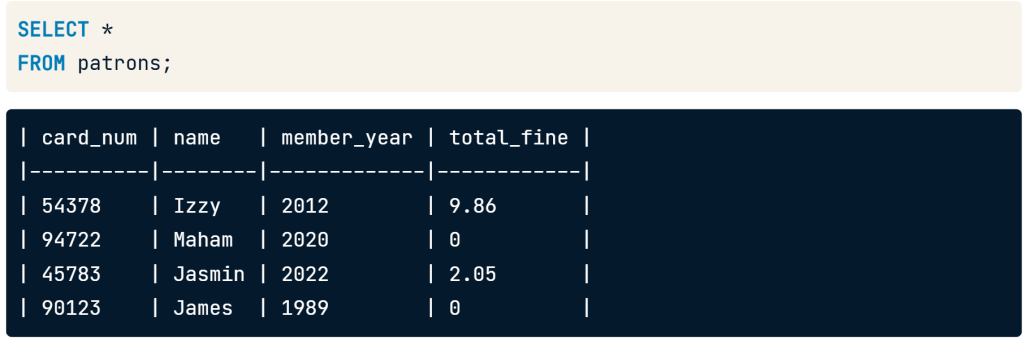
Table show relation patrons, books and checkouts
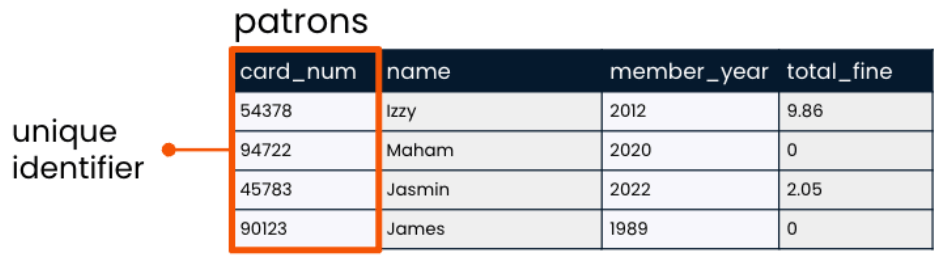
Patrons Table
Column (field name)
Definition
card_num
card number
name
name
member_year
the year the patron became a library member.
total_fine
the total overdue
Relational Database – -> relation between tables of data insider the database
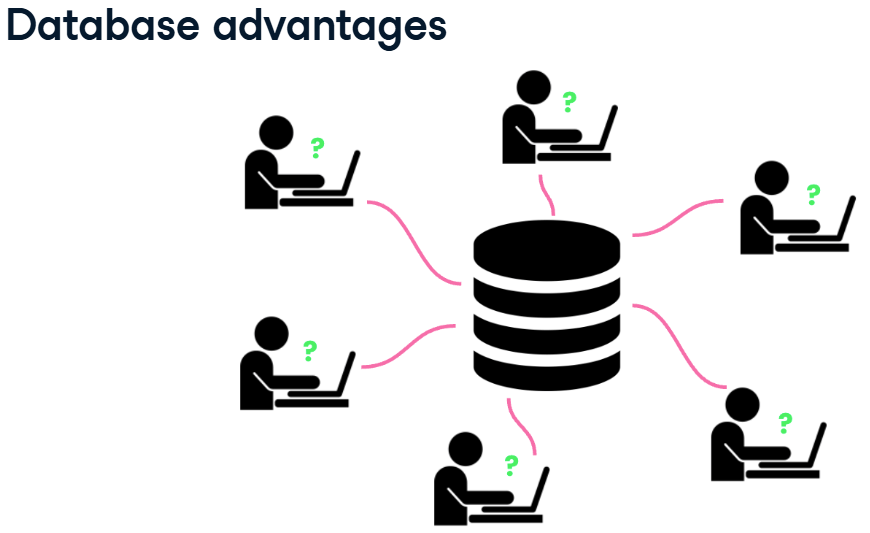
Database Benefits
Database have more storage than spreadsheet application.
Many users can write queries to gather insights from the data at the same time.
when a database is queried, the data stored insider the database not change.
Tables
Definition
databases are organized into tables, which hold related data about a particular subject.
tables are organized into rows and columns.
in the world of databases, rows are often referred to as records and columns as fields.
relation between patrons table and checkouts table connect with card_num column, book table and checkouts table connect with id column.
Create Table Name
lowercase
no space and – in table name (use underscores instead)
plurals
Record and Field
Records
Laying the table : records
A record is a row that holds data on an individual observation.
records pf patron table
Fields
Laying the table : fields
A field is a column that holds one columns of data for all records.
fields of patrons table
Table manner
Qualification
Singular name
No lowercase
No space
be different from other field name
be different from the table name
restrict of create name
Assigned seats
A unique identifier is used to identify records in a table.
Distinct and often number.
unique identifier
Create books table
A database has been set up for this course and the books table is available here.
Run the code to explore what data books holds!.
SELECT * FROM books;
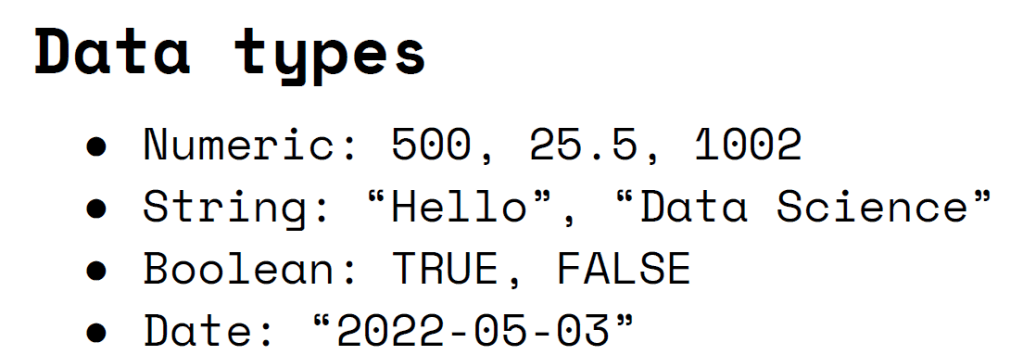
SQL data types
When a table is created, a data type must be indicated for each field. The data type is chosen based on the type of data that the field will hold a text and number.
String data type: field name, Integer data type : field member_year, Floats data type : field total_fine
SQL Data type
Attribute
String
letters or punctuation
Integers
whole number
Floats
fractional number
String
String is a sequence of characters such as letters or punctuation.
VARCHAR is a flexible and popular string data type in SQL.
String field : field name
Integers
Integers is wholenumber
INT is popular integer data type in SQL.
Integer field : field member_year
Floats
Float store numbers that include a fractional part
NUMERIC is popular float data type in SQL
Float field : field total_fine
Schema
A schema shows a database’s design, such as what tables are included in the database and any relationships between its tables.
Schema show database’s design
Querying
Introducing queries
Benefits of SQL
use SQL to find which books James checked out from the library in 2022.
relation between card_num checkouts tables and patrons table.
use SQL queries to uncover trends in website traffic, customer reviews, and product sales.
Question
Which products had the highest sales last week?
Which products get the worst review scores from customers?
How did website traffic change when a feature was introduced?
Keyword
Keyword is word for operations. Common keywords : SELECT, FROM
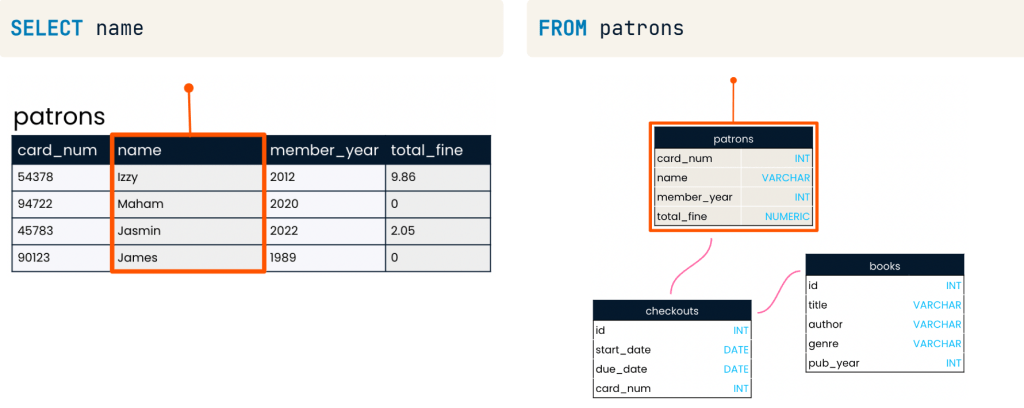
The SELECT keyword indicates which fields should be selected
The FROM keyword indicates the table in which these fields are located
Keyword SELECT and FROM
SELECT name FROM patrons;
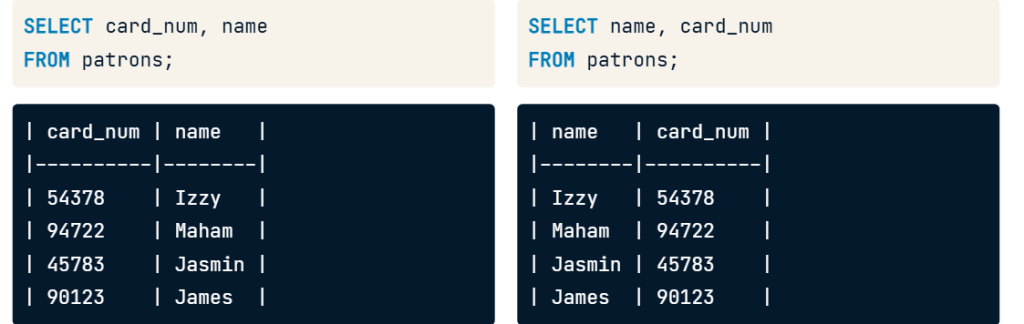
Selecting multiple fields
Can select field to that want show data example card_num and name
SELECT card_num, name FROM patrons;
It will show field that select first as picture below.
SELECT card_num, name vs SELECT name, card_name
Selecting all fields
if you want to show all data use asterisk(*) to select all four field name.
SELECT * FROM patrons;
SELECT * FROM patrons;
Writing queries
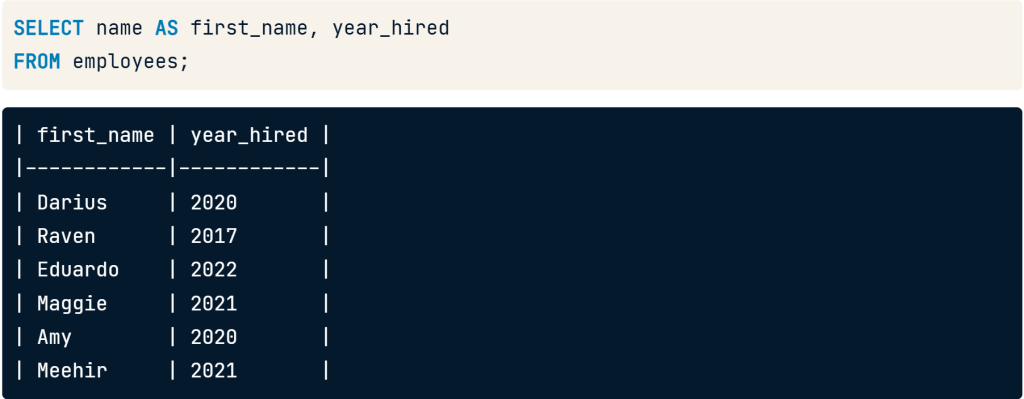
Aliasing (Rename Column)
Use aliasing to rename column.
Use SELECT name AS first_name to change field name from name to be first_name.
SELECT name AS first_name, year hired
FROM employees;
SELECT name AS first_name
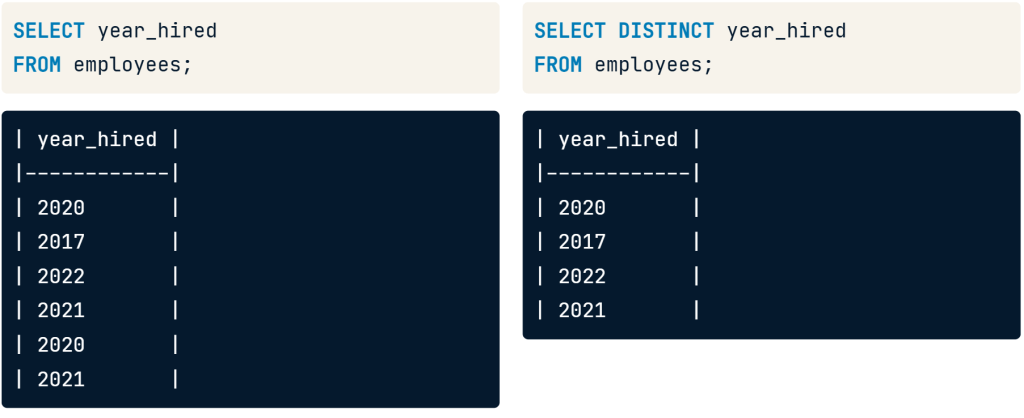
Selecting Distinct Records
if you select year_hired it will show result duplicate year 2020 and 2021
we can add the DISTINCT keyword before the year_hired that make data show 4 year distinct.
SELECT DISTINCT year_hired
FROM employees;
SELECT DISTINCT year_hired FROM employees;
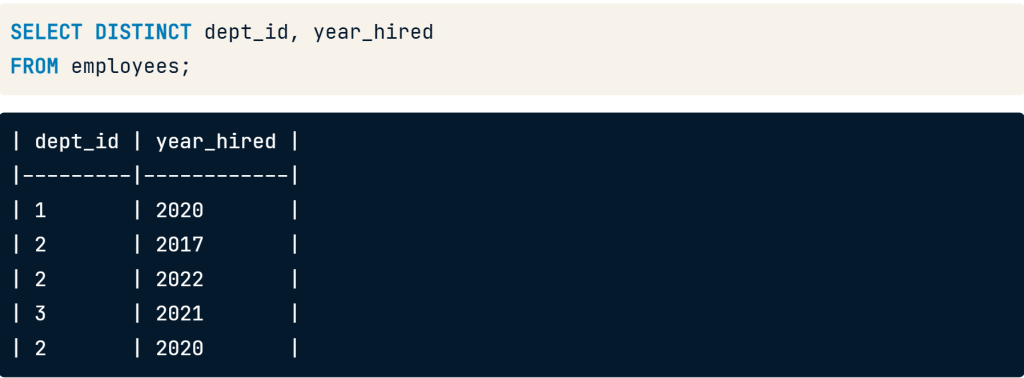
Distinct with multiple fields
add the DISTINCT keyword before the fields to select
the department id and year_hired fields still have repeat values individually, but none of the records are the same
SELECT DISTINCT dept_id, year_hired
FROM employees;
SELECT DISTINCT dept_id, year_hired FROM employees;
Views
A view is a virtual table that save SQL SELECT statement
When accessed, views automatically update in response to updates in the underlying data.
CREATE VIEW employee_hires_years AS
SELECT id, name, year_hired
FROM employees;
CREATE VIEW, then the name will create the new view.
Using views
we can query it just as we would a normal table by selecting FROM the view.
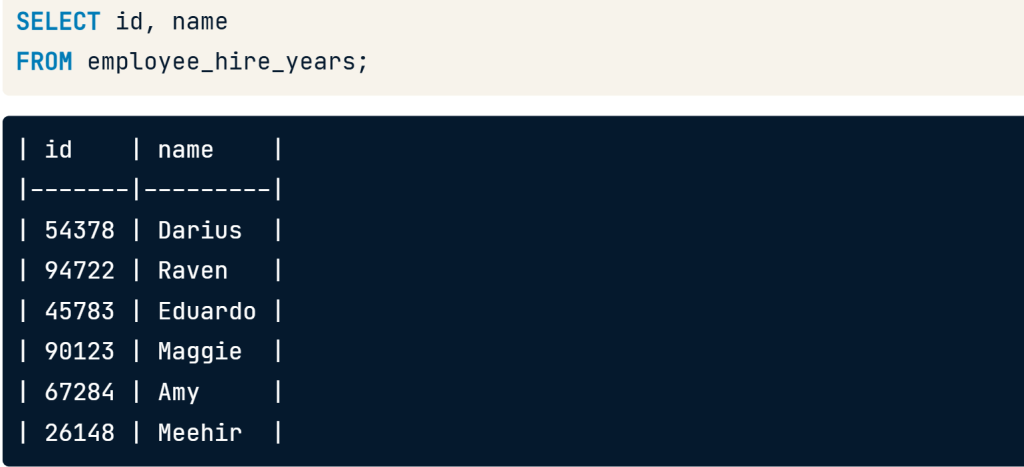
SELECT id, name
FROM employee_hire_years;
SELECT id, name FROM employee_hire_years;
-- create the view:
CREATE VIEW library_authors AS
SELECT DISTINCT author AS unique_author
FROM books;

-- Select all columns from library_authors
SELECT * FROM library_authors
sample of CREATE VIEW use case.
Viewing your query
You have worked hard to create the below SQL query:
SELECT DISTINCT author AS unique_author
FROM books;
SQL flavors
Both free and paid
All used with relational database
Vast majority of keywords are the same
All must follow universal standards
Two popular SQL flavors
PostgreSQL
SQL Server
Free and open-source relational database system.
Has free and paid version
Created at the university of California, Berkeley
Create by Microsoft
“PostgreSQL” refers to both the PostgreSQL database system and its associted SQL flavor
T-SQL is Microsoft SQL flavor, used with SQL Server databases
Comparing PostgreSQL and SQL Server
--PostgreSQL:
SELECT id, name
FROM employees
LIMIT 2;
--SQL Server:
SELECT TOP(2) id, name
FROM employees;
PostgreSQL vs SQL server
SQL Server using the TOP keyword instead of LIMIT. Notice that this keyword is the only difference between the two queries!
Summary
“I hope the foundational knowledge for advancing projects in the following five areas will be helpful for everyone:
Data analyst is an essential tool that enables organizations to gain deeper insights into their data. Utilizing Microsoft Excel for efficient data processing facilitates accurate and prompt decision-making while identifying trends and uncovering new business opportunities.
Excel work with a prepared spreadsheet that contains sale
The 5 steps for analyzing the sales_data_analysis.xlsx file in Microsoft Excel 365 are as follows
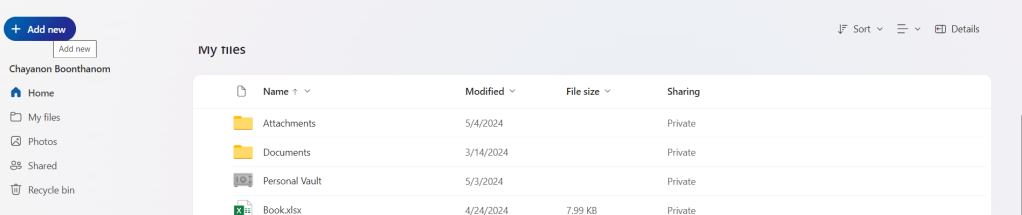
Upload a document using the free online version of Microsoft Office 365
One drive to upload excel file
Click add new → File upload → then upload → sales_data_analysis_23.10.2024
Go to Insert → Table to create a table that uses the header in the first column to filter data. → Click OK.
To Createa table to filter data, see the picture below.
Create Table in microsoft excel 365
Then filter the data shown in the picture below.
can filter data by columns such as Num, Date, Month, Sales Rep, Region, Customer ID, etc.
Set it up so that when you scroll down to view data in the rows below, the first column remains visible. This makes it much easier to reference the headings.
Perform data analysis using sorting and filter tools.
Which column should be prioritized for sorting data to make it more effective?
representative header and then select sort A to Z to sort it in alphabetical order
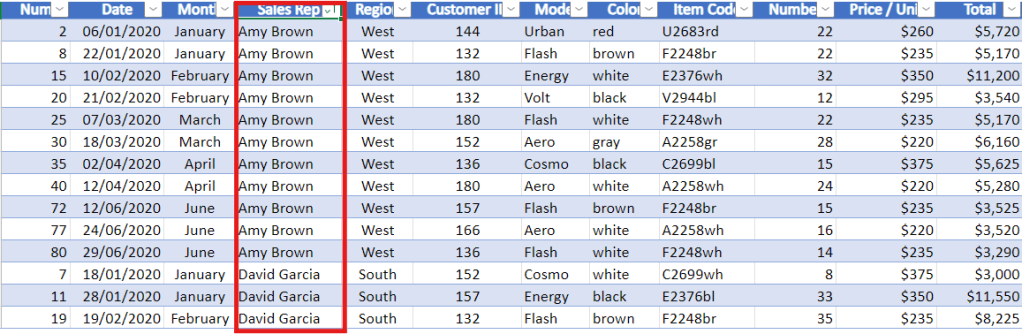
Sort the Sales Rep column from A to Z.
after click it has been rearrange by alphabetical Sales Rep
then to make it back to select sort in column date again
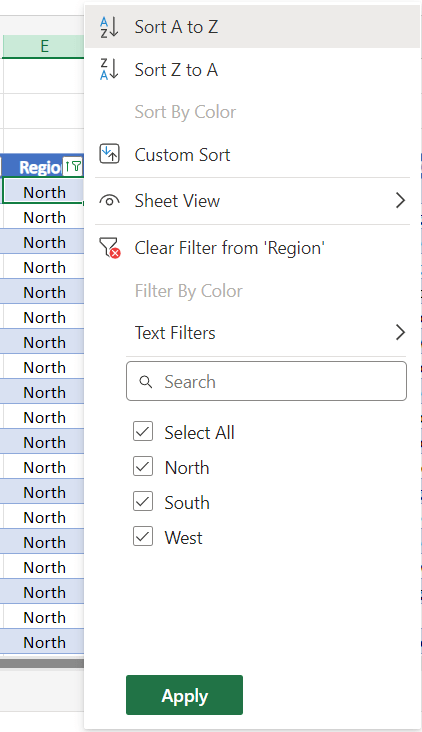
can sort the Region by North.
Filter by North Region.
To remove the filter, click the ‘Select All‘ checkbox to display sales from the North, South, and West regions, and then click.
Then filter the Sales Rep column by the name David Garcia.
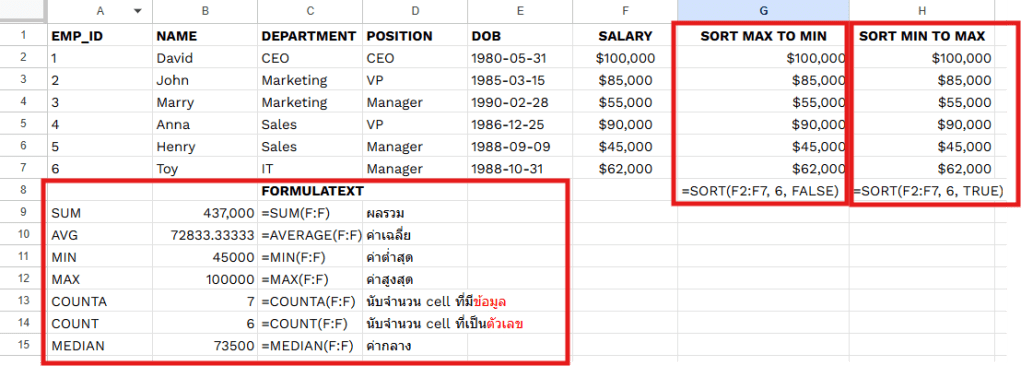
Calculate in the bottom right corner.
What you can see from data?
Average of $7,893
Count of 9
Sum of $71,040
you can see aggregate value in the bottom right corner.
This is how to use the sorting and filtering tools to rearrange your data.
Perform data mining using the IF Function
The idea behind data mining is to take the data you already have and create new or additional data from it.
The IF function is frequently used.
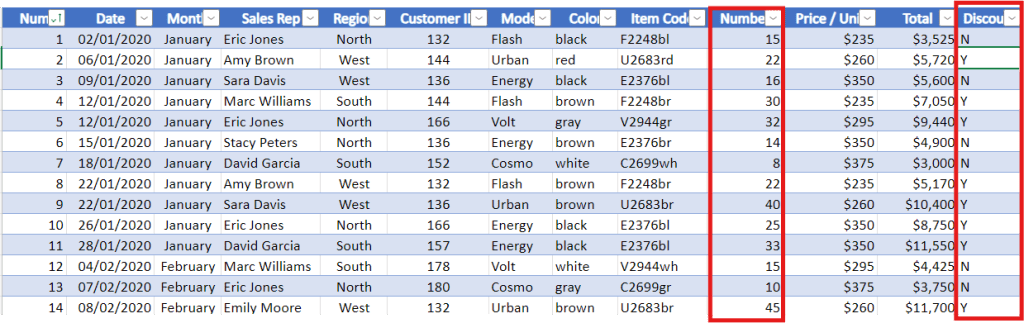
Samples show that when an order includes 20 chairs or more, the client receives a 5% wholesale discount.
Discount Column 3 Method
1. Create a discount column to the right to reflect this.
2. In the column, use ‘Y‘ for orders with a quantity ≥ 20.
3. In the column, use ‘N‘ for orders with a quantity ≤ 20.
Code for column Discount
=IF(J5>=20,"Y","N")
Create a discount column based on the quantity in the number column.
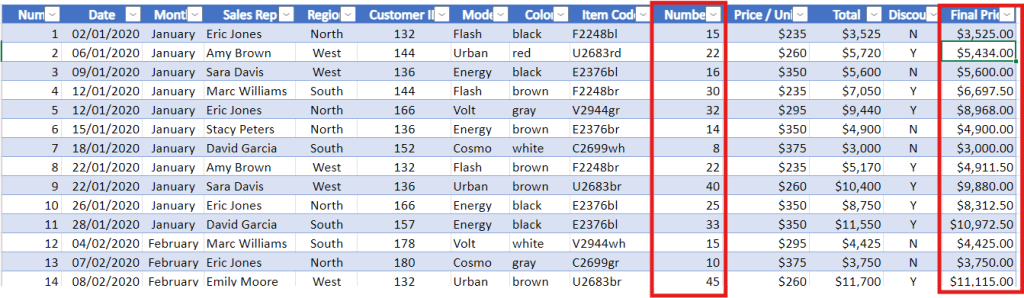
Final Price column
Code for column Final Price
=IF(J5>20,0.95*L5,L5)
Create a Final Price column based on discount and number column.
column of Discount with Y is number ≥ 20 price is discount 5% final is 95% from total column
column of Discount with N is number ≤ 20 price is same as the total
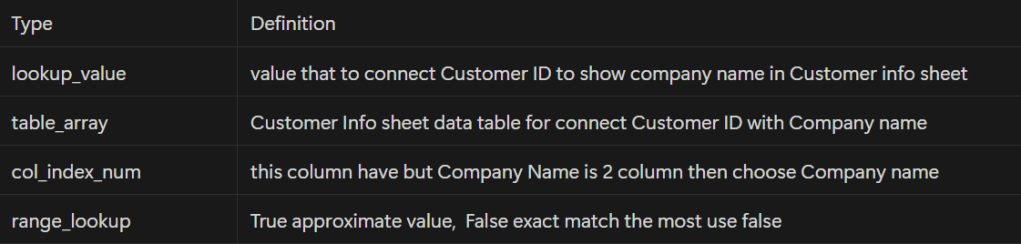
Create references between tables and search for information with VLOOKUP
Goal is to insert the company name using the client ID.
Create column Company Name between Customer ID and Color
Create column Company Name Representative between Company name and model
Data analysts help organizations gain valuable insights from data. Using Microsoft Excel enhances decision-making by processing data efficiently and identifying trends and opportunities.
สามารถดึงข้อมูลจาก Social Media Platforms ด้วยตัวเอง เช่น Facebook, Instagram, Twitter โดยใช้ Supermetrics + Google Sheets
Google Sheets & Looker Studio
โดย 2 เครื่องมือที่นิยมใช้ในงาน Social Listening คือ Excel/ Google Sheets และ BI Tools เช่น Looker Studio หรือ Power BI เพื่อทำรายงาน dashboard ติดตามผลง่ายๆ
ใช้สำหรับ Social Listening ใช้ Google Sheets + Looker Studio เป็นหลัก
Case Study : Oppo Find N2 Flip Launch
ทีมการตลาดของ Oppo Global ได้หา insights ว่าลูกค้าที่ใช้โทรศัพท์จอพับมีปัญหาอะไรบ้าง (จากการทำ research และ social listening) พบว่าสามปัญหาที่ลูกค้าบ่นเยอะที่สุดคือ
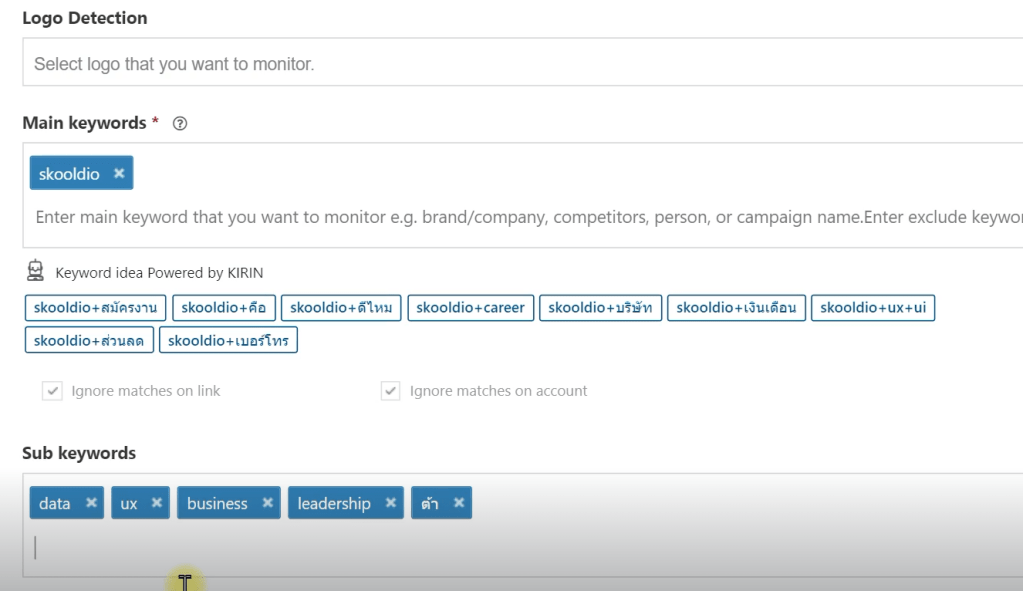
ระหว่าง Extract กับ Analyze ใช้ Negative key word ในการดึงข้อมูลที่ไม่สำคัญทิ้งไป
Sub keyword ใช้ในการวิเคราะห์ เช่น กล้อง ราคา promotion
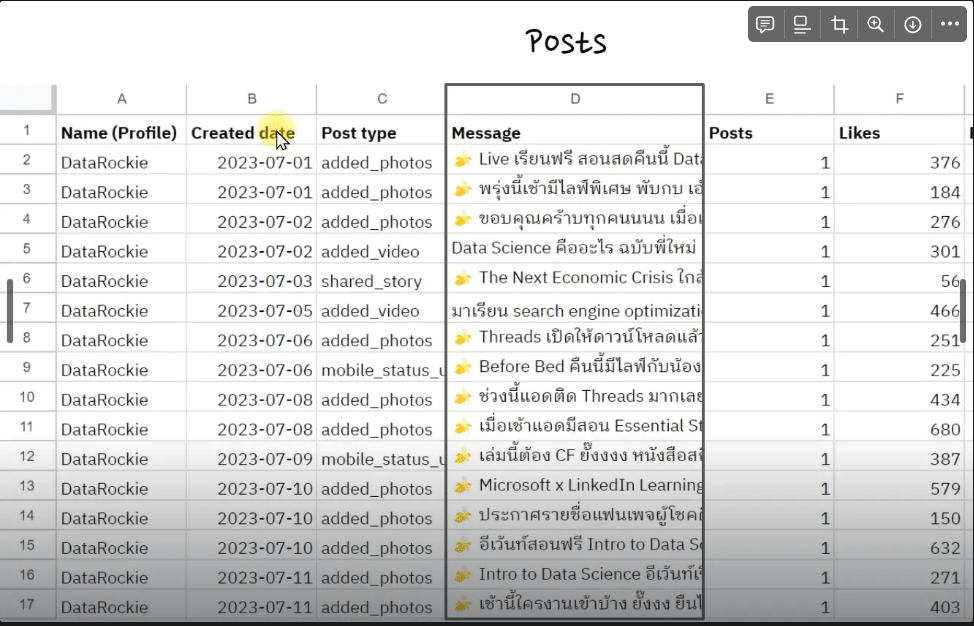
Zocial Eye Dashboard รูปภาพจาก Social Listening — Data Analyst Edition by DataRockie
Extract Data for Zocial Eye
Extract Data From Platform
การดึงข้อมูลจาก Platform ต่างๆ
Facebook Data
Instagram Data
Application Program Interface
Facebook Data
จะเริ่มดึงข้อมูลจาก Social Media Platform โดยใช้ Supermetrics ในการดึงข้อมูลจาก facebook public page
สามารถใช้ application นี้ฟรี 14 วัน
ตัวอย่างนี้เป็นการลองดึงข้อมูลจาก Facebook Public Post แบบง่ายๆด้วย Supermetrics แค่เลือก data source -> page -> period -> dimensions/ metrics ที่ต้องการ
Instagram Data
Extract ข้อมูลผ่าน IG Data
โดยการดึงข้อมูลจาก Instagram ผ่าน hashtag
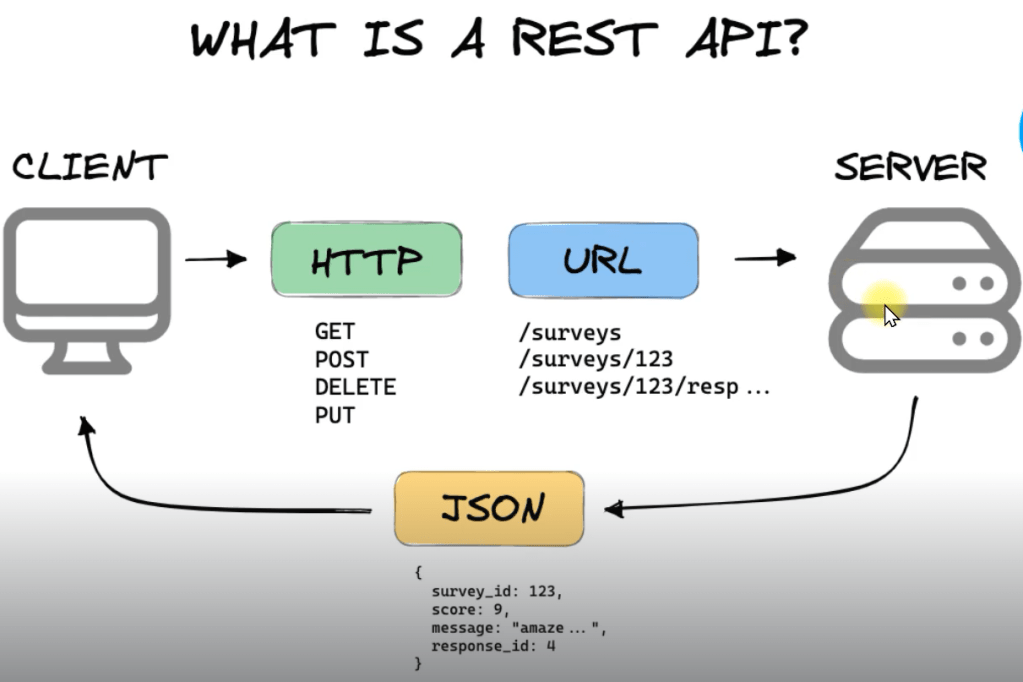
Application Program Interface
รูปภาพ API Process จาก Social Listening — Data Analyst Edition by DataRockie
API ย่อมาจาก “Application Program Interface” (ส่วนต่อประสานโปรแกรมประยุกต์) ในบริบทของ API คำว่า “Application” หมายถึงทุกซอฟต์แวร์ที่มีฟังก์ชันชัดเจน ส่วน “Interface” อาจถือเป็นสัญญาบริการระหว่างสองแอปพลิเคชัน ซึ่งสัญญานี้จะกำหนดวิธีที่ทั้งสองสื่อสารกันโดยใช้คำขอและการตอบกลับ
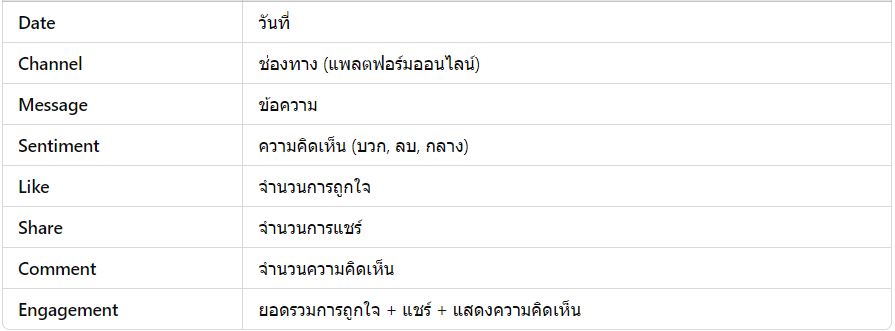
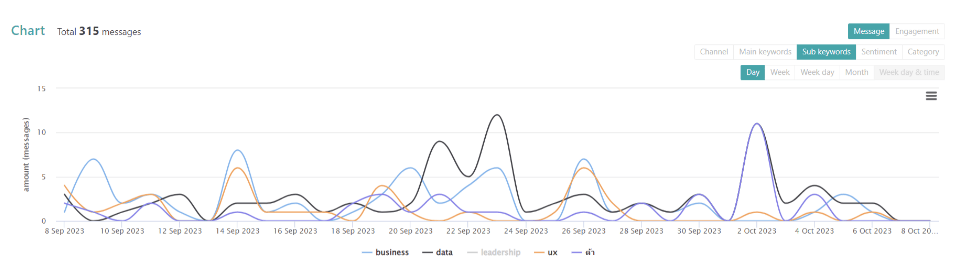
รูปภาพ keyword and sub keyword จาก Social Listening — Data Analyst Edition by DataRockie
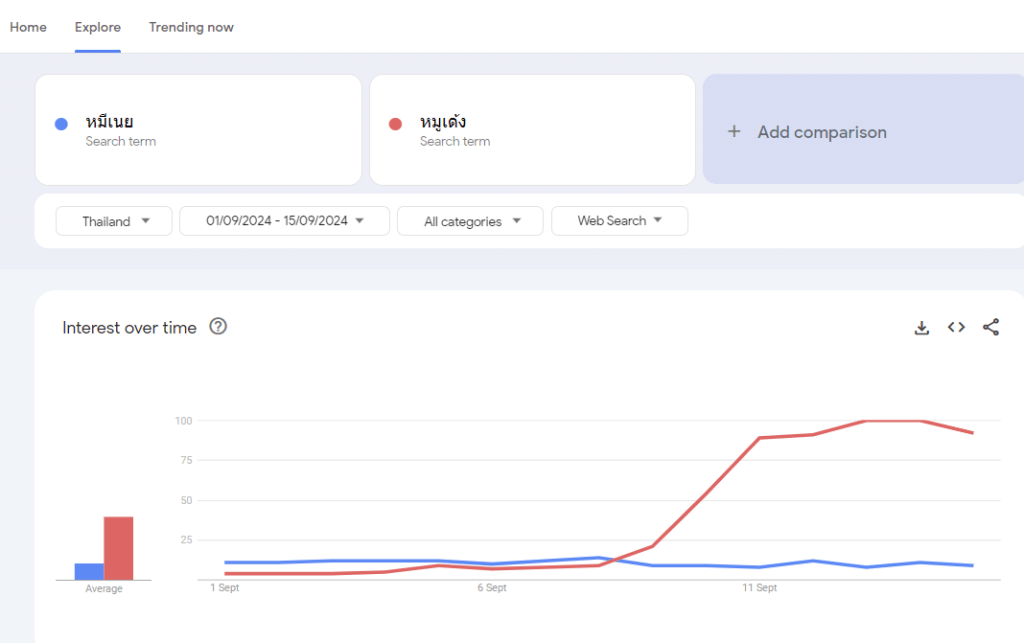
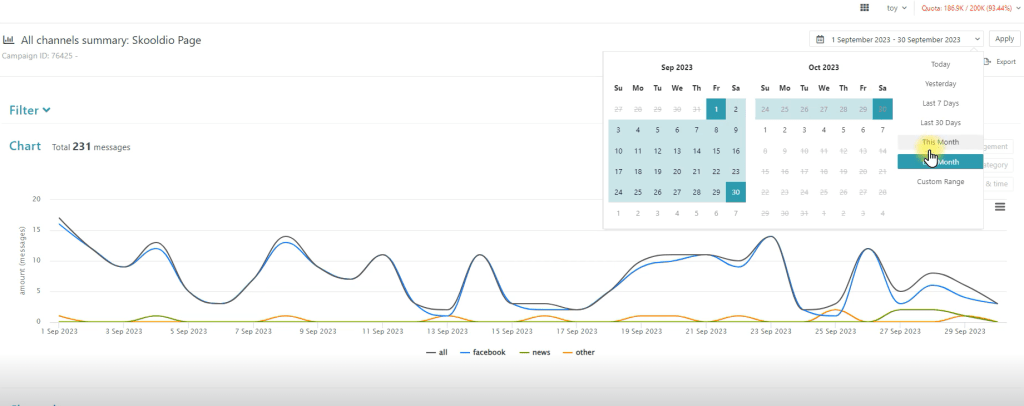
Check Period
หาช่วงเวลาให้ตรงกับที่เราสนใจก่อน แล้วจะได้เปรียบเทียบข้อมูลทั้ง 3 platform facebook, new and other
check period หาช่วงเวลาให้ตรงกับที่เราสนใจก่อน แล้วจะได้เปรียบเทียบข้อมูลทั้ง 3 platform facebook, new and other รูปภาพจาก Social Listening — Data Analyst Edition by DataRockie
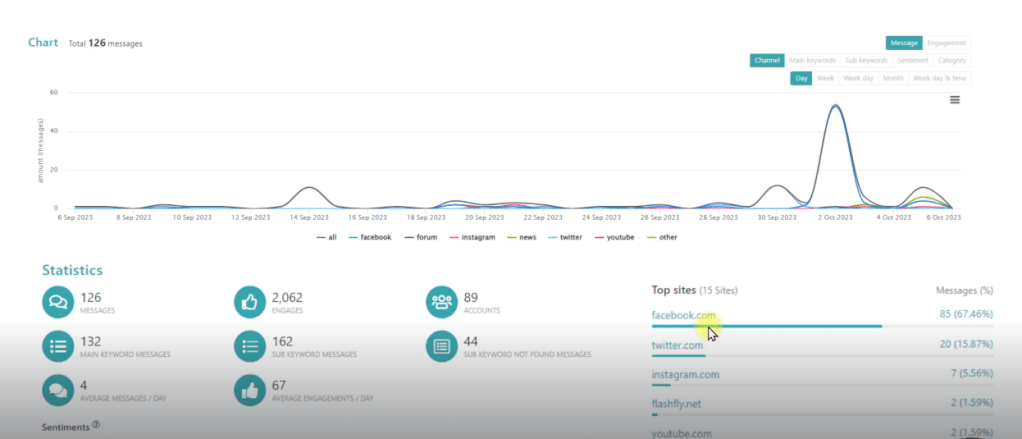
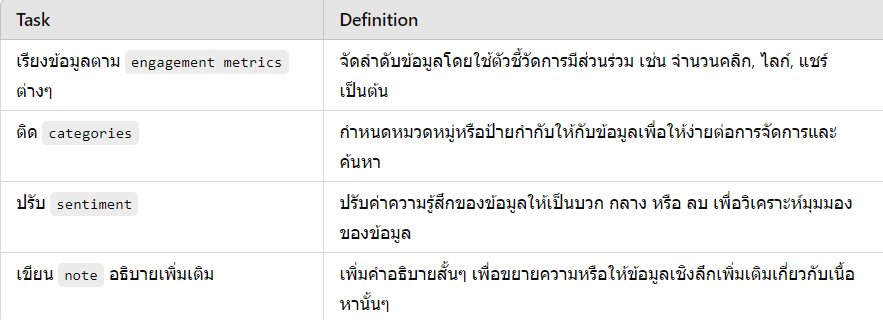
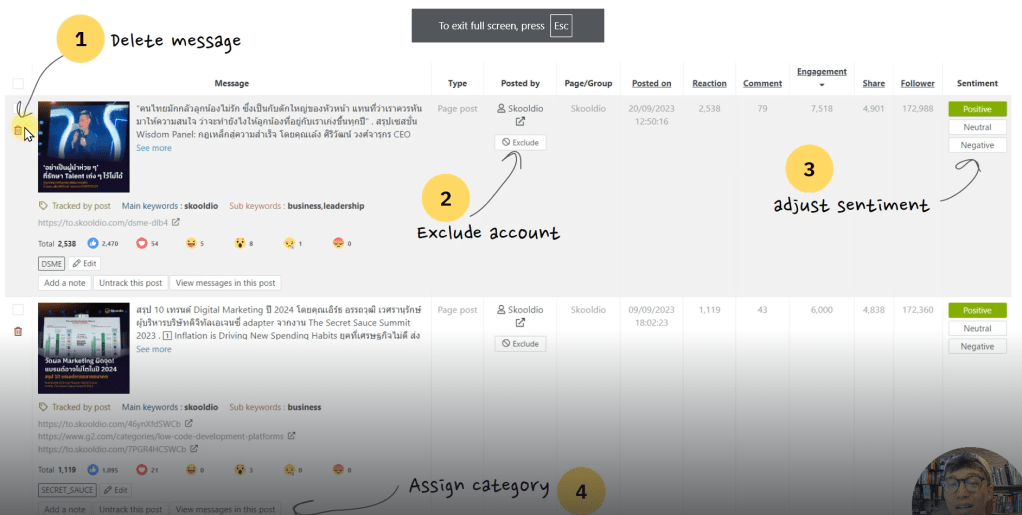
สามารถดูหน้าโพสต์นั้นผ่าน All channels skoodio Page ได้เลย
สามารถเปลี่ยน sub keyword หรือ message ที่จะหาได้ตลอดเลย
สามารถดู sentiment ได้ตรง top message engagement ได้เลย
รูปภาพจาก Social Listening — Data Analyst Edition by DataRockie
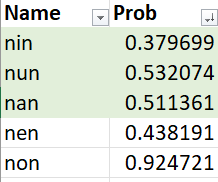
Do sentiment analysis for this “message” using options [“neutral”, “positive”, “negative”].
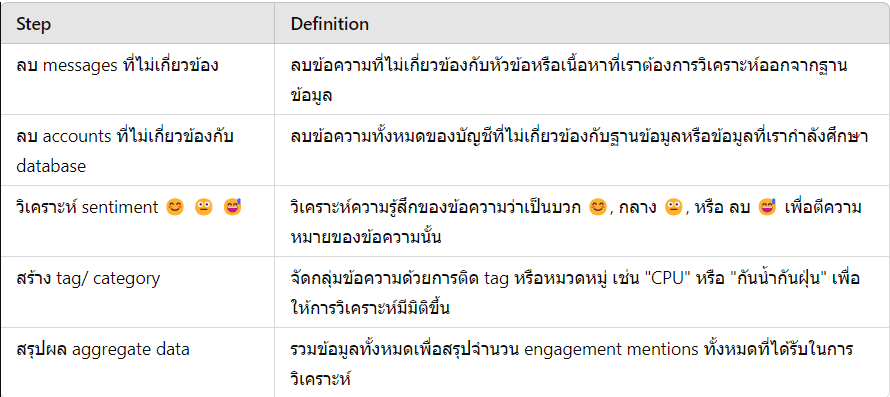
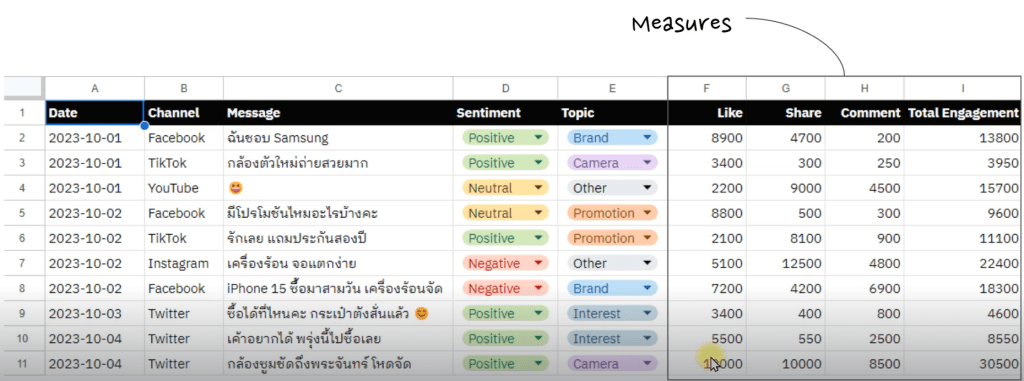
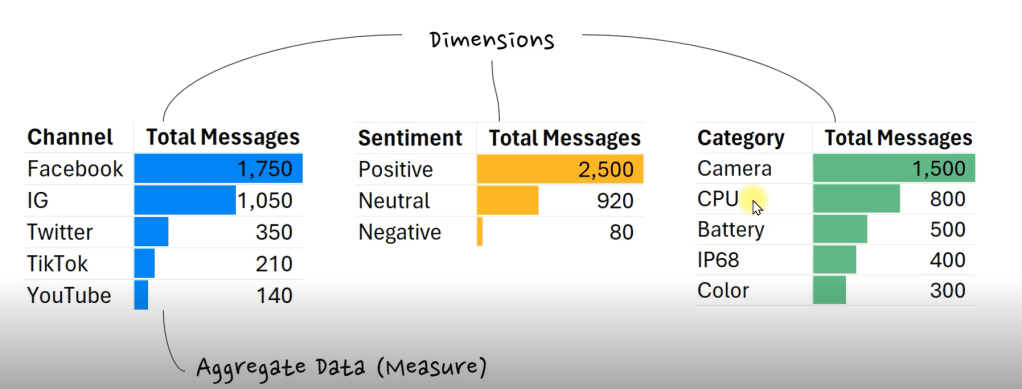
Aggregate Data
ก่อนที่เราจะเข้าสู่ Phase 3 [Present] ของโปรเจ็ค Social Listening เราจะทำการ Aggregate Data ให้อยู่ในรูปแบบ Table ที่เข้าใจง่ายๆก่อน
เครื่องมือที่เราใช้ทำ Aggregate Data ที่ง่ายที่สุดคือ Pivot Table ใน Excel/ Google Sheets หรือจะใช้ BI Tools ที่กำลังเป็นที่นิยมตอนนี้ เช่น Looker และ Power BI ก็ได้
5. Word Cloud ใช้แสดงผลข้อความ phrase หรือ #hashtag ที่มีการ mentions เยอะๆในข้อมูล font size ยิ่งใหญ่ แปลว่ามีการพูดถึงคำนั้นเยอะ
Word Cloud สำหรับคำที่มีการพูดถึงเยอะ
Zocial Eye Dashboard มี common charts ทั้งหมดนี้ให้เราใช้งานได้เลย แต่ถ้าอยากจะ export data ออกมาทำเองแบบ manual ก็ได้เช่นกัน (หรือเอา raw data ไปขึ้น BI tools)
เราสามารถโหลดข้อมูลที่ได้จาก Social Listening Tools เข้า Business Intelligence (BI) Software เช่น Looker Studio, Power BI หรือ Tableau เพื่อทำ Report และ Dashboard เสนอผลวิเคราะห์
สำหรับ Program Google Looker Studio มีขั้นตอนดังนี้
Export file csv to looker studio
+ Blank Report page in looker studio
click to upload file
add to report
แล้วสามารถใส่ chart ตามใจชอบ
Sample Looker Studio
Slide Making
ทีม Data Analyst ใช้ Slide Presentation ในการนำเสนอ Insights ที่น่าสนใจ
Software ที่เราใช้ทำ Slide Presentation เช่น
PowerPoint (Windows)
Keynote (Mac OS)
Google Slides (Web-Based)
Canva (Web-Based)
Tip – หลายคนอาจจะไม่รู้ แต่ Slide Making คืออีกหนึ่งทักษะสำคัญของการเป็น Data Analyst ที่ดีเลย หรือที่เราเรียกกันว่า Communication Skill (ใน Job Description/ Requirement)
Slide Making
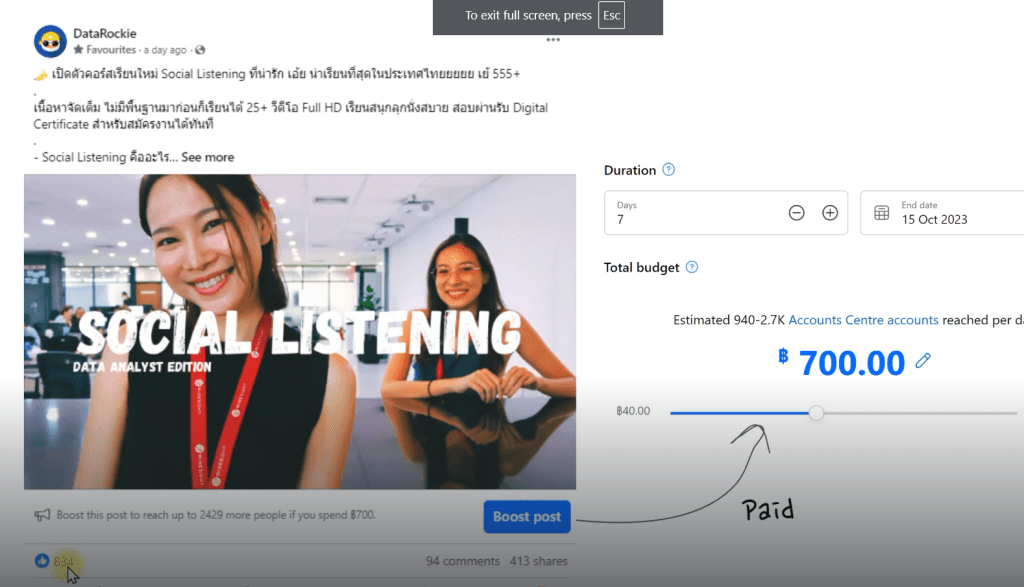
Limitations of Social Listening Data
ข้อจำกัดของข้อมูล Social Listening ที่เราเก็บเข้ามาในระบบ
เราไม่สามารถแยกระหว่าง Organic vs. Paid ได้ นอกจากเราจะเป็นเจ้าของ Page/ Channel นั้นๆถึงจะรู้ว่าโพสต์ไหนบ้างใช้เงินอัดโฆษณา
Boost post
เรื่องการ Update ระบบ Social Listening จะมีรอบในการวิ่งกลับไปเก็บข้อมูลล่าสุด เช่น Post วันที่ 1 ก.ย. 2023 จะมีการวิ่งกลับไปเก็บอีกสองครั้งวันที่ 8 และ 15 ก.ย. 2023 หลังจากนั้น ระบบจะหยุดเก็บข้อมูลแล้ว ทำให้ตัวเลขบน Social Media กับใน Report อาจจะไม่ตรงกันเป๊ะ 100%
Social Media Inaccuracy
Social media platforms บางตัวยังไม่เปิดให้ใช้งาน Public API เช่น TikTok (อัพเดท ต.ค. 2023) หรือมี API ให้ใช้ แต่ไม่ส่งค่าบางอย่างกลับมาเช่น Facebook API ยังไม่แชร์ค่า Video Views บน Page กลับมาให้เราวิเคราะห์ต่อ ต้องไปดึงแบบ manual เอง