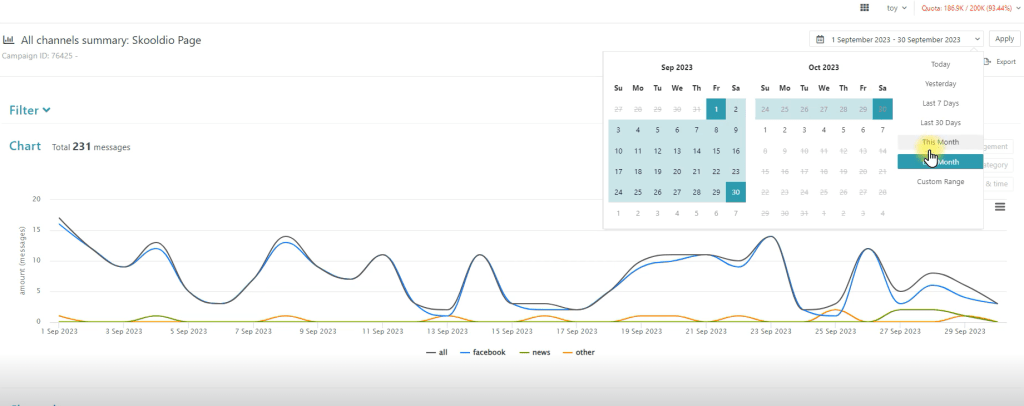
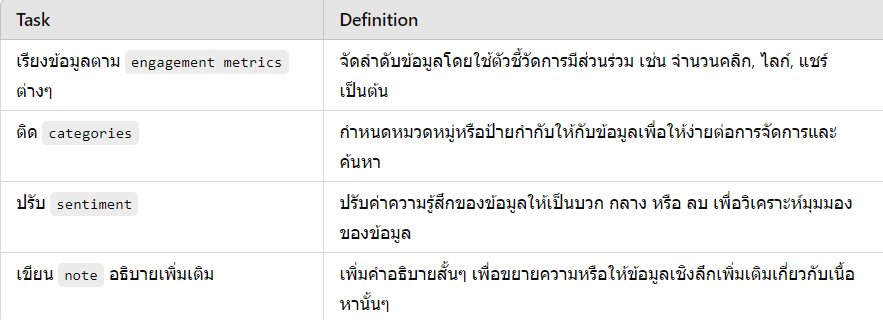
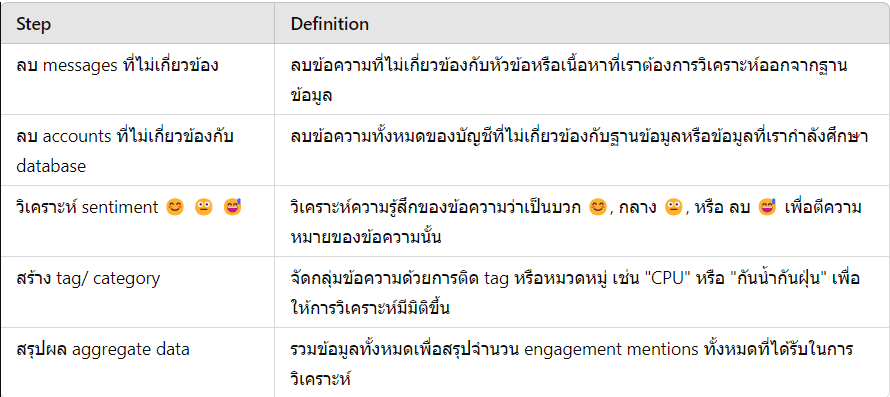
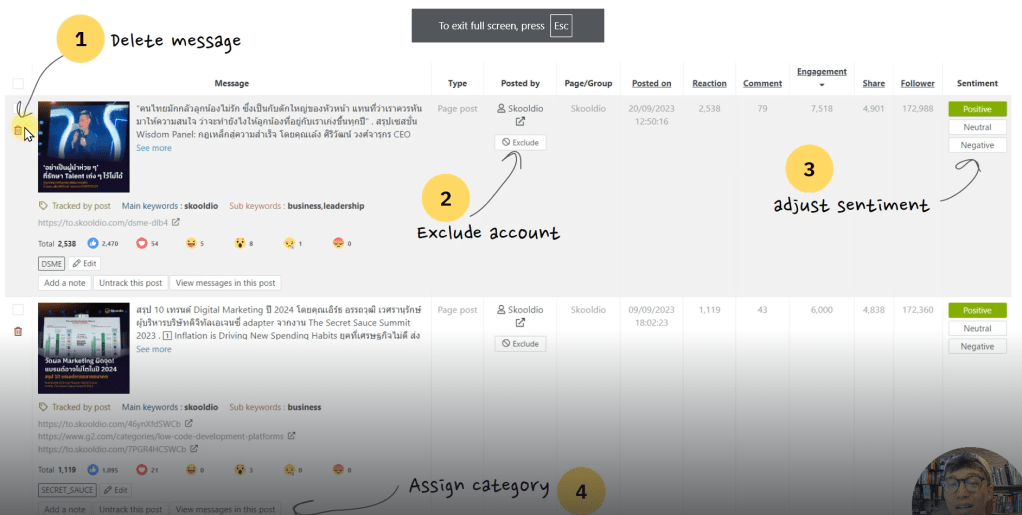
เป็นบทความจากงาน What the duck 2024 เกี่ยวกับ The Future 2025 , AI And Language , Math , Happiness and How to Survive ✌️✌️✌เพื่อให้ทุกท่านที่อ่านบทความนี้สามารถมีแนวทางการใช้ชีวิตจาก Speaker ทั้ง 5 ท่านโดยเฉพาะ part ที่เป็นหนังสือ The Kybalion ซึ่งมีความรู้แน่นสุดๆ แน่นอนครับ
Table of Content
- Role
- Future
- Marketing
- The future of data & AI Trends
- AI imperative and risk, new frontiers
- Big Tech Change
- Management Data
- ChatGPT and Generative AI
- Ability of Generative AI
- Step Create ChatGPT
- Mathematics is a science of pattern
- Recipes Food
- Nature of Mathematic
- Fotofile
- Advantage of Fotofile
- Scope and Depth
- Happiness by P. March
- Thinking
- How to Survive the next 100 years
- The Future
- Future Trend in 2025
- The Present
- 5 Method of good life
- Leverage
- What is your hourly rate?
- Mental Model
- The Meta Skills
- Education
- Fiat Money
- Inflation
- How do you create value?
- Happiness
- Make a Decision Judgement
- Value vs Price
- Water vs Diamond
- The Truth
- A Prediction Machine
- Hallucination
- The Past
- Old Question
- The Kybalion
- Master Keys
- Mentalism
- Correspondence
- Polarity
- Vibration
- Rhythm
- Cause and Effect
- Gender
- Mental Power
The Future
Speaker by P. Tor Predictive
Role
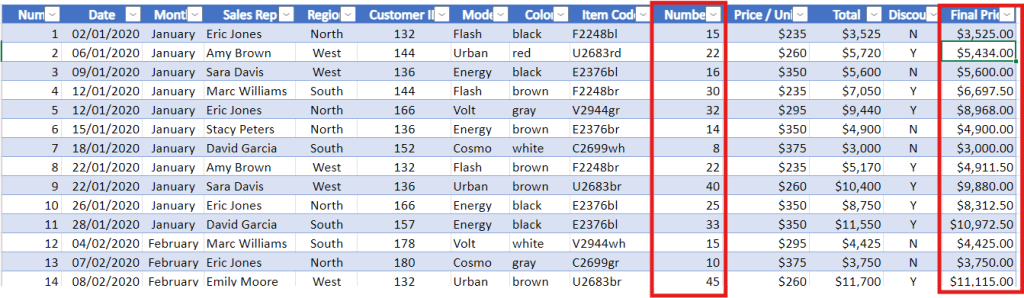
- ปัจจุบัน Predictive เป็น consult ให้ลูกค้า Bank ขนาดใหญ่ในประเทศ
Future
สำหรับ predictive อนาคตในการทำงาน data analyst เป็นยังไงบ้างในอนาคต ❤️❤️
- สิ่งที่มีแนวโน้มที่จะเห็นในอนาคตปี 2025 ภายในปีหน้า
- Insight —>The future measurement ข้อมูลเชิงลึกสามารถวัดอนาคตที่จะเกิดขึ้น
ถ้าต้องการ marketing หรือ customer data → 30% cookie less ข้อมูลไม่พร้อมที่จะใช้งาน เนื่องจากเริ่มมี Privacy Consent ความคุ้มครองจากผู้บริโภคที่ไม่อนุญาตให้ดึงข้อมูลไปใช้

- Must Change mindset
Marketing
- Improving measurement of our digital advertising
- ไม่สามารถทำ Campaign ได้ดีเหมือนเดิม เพราะว่าบางข้อมูลไม่เชื่อมกัน
- บางที user ส่วนใหญ่มีคนกด Consent banner (ขอความยินยอมการเก็บไฟล์คุกกี้ของผู้ใช้เว็บไซต์หรือเจ้าของข้อมูลส่วนบุคคล)
Performance Marketing Low → Cookie หรือ browser ที่หายไป
Third-Party Cookies: คุกกี้ตัวนี้เป็นคุกกี้ที่อนุญาตให้ Third-Party สามารถเข้าถึงและแสดงโฆษณาต่อผู้เข้าชมเว็บไซต์ได้ โดยที่ Third-Party Cookie จะแอบติดตามความเคลื่อนไหวของเรา ทั้งประวัติการเล่นเว็บไซต์ พฤติกรรมออนไลน์ ไปจนถึงลักษณะการใช้จ่ายต่าง ๆ

→ impact เรื่อง signal จะน้อยลง (ข้อมูลไม่จำเป็นต้อง 100%)
3 Key Takeaways
| Keys | Definition |
| 1. Aggregated Measurement | การรวบรวมข้อมูลจากแหล่งต่างๆ และนำมาประมวลผลเพื่อหาค่าสรุปหรือภาพรวม |
| 2. Building and Integrating data | กระบวนการสร้างฐานข้อมูลใหม่หรือการนำข้อมูลจากแหล่งต่างๆ มารวมเข้าด้วยกันในระบบเดียว |
| 3. Cross-function Strategy | กลยุทธ์ที่เกี่ยวข้องกับการทำงานร่วมกันของทีมงานจากหลายแผนกหรือหลายสายงานในองค์กร เพื่อให้บรรลุเป้าหมายร่วมกัน |
- องค์กรไหนสามารถเชื่อมโยงข้อมูลเหล่านี้เข้าด้วยกันมากสุดเมื่อไรก็จะยิ่งได้เปรียบทางการค้ามากขึ้น
The future of data & AI Trends
- Data Improve fast with 5 levels
| Level of AI | Definition |
| 1. Emerging | AI เป็นขั้นเริ่มต้นที่ความสามารถยังจำกัด |
| 2. Competent | AI ที่มีความสามารถทำตามแผนที่วางไว้ได้ระดับหนึ่ง |
| 3. Expert | AI ที่มีความสามารถสูงระดับมนุษย์ |
| 4. Virtuoso | AI ที่มีความสามารถเหนือชั้นในงานที่ทำ มีความคิดสร้างสรรค์ |
| 5. Superhuman | AI ที่เหนือมนุษย์ในทุกด้าน ทั้งความเร็วในการประมวลผล ความแม่นยำ และความสามารถในการเรียนรู้ |
- ปัจจุบันอยู่ในขั้น Generative Competent 2025 😊😊😊
ปี 2025 จะมีระบบ Software 3.0+ Prompt + Chain Agent Definitions
- ความสามารถของ AGI จะพัฒนาเร็วขึ้นเรื่อยๆ
AI imperative and risk, new frontiers
- แรงผลักดันที่สำคัญและเร่งด่วน โดยมีความเสี่ยงที่อาจเกิดขึ้นจากการพัฒนา AI ในรูปแบบที่ไม่เคยปรากฎมาก่อน
Prediction for 2025 หลายๆ task จะถูกให้ AI ทำแทนได้เช่น เอกสาร A นำมาเปรียบเทียบกับ เอกสาร B ให้ Co-pilot ช่วยดูว่าเอกสาร 2 ฉบับแตกต่างกันตรงไหน อย่างไร
- 2025 Agentic จะอยู่ใน App Store และจะมี Real-time speech translation
- cost ในการทำ model จะราคาถูกลงเรื่อยๆ อย่างชัดเจน
ModelOps → Composite AI → Generative AI → Adaptive System
| Model AI | Definition |
| 1. ModelOps | แนวทางปฏิบัติในการจัดการวงจรชีวิตของโมเดล Machine Learning (ML) |
| 2. Composite AI | การรวมเทคนิค AI หลายๆ แบบเข้าด้วยกัน เช่น Machine Learning, Natural Language Processing (NLP), Computer Vision, Knowledge Graph |
| 3. Generative AI | เป็น AI ที่สามารถสร้างเนื้อหาใหม่ๆ ได้ เช่น ข้อความ รูปภาพ เสียง วิดีโอ หรือโค้ด โดยเรียนรู้จากข้อมูลที่มีอยู่ เช่น GPT แปลข้อความ Dall-E สร้างเสียงและรูปภาพ |
| 4. Adaptive System | ระบบที่สามารถปรับตัวและเปลี่ยนแปลงตัวเองได้ตามสภาพแวดล้อมที่เปลี่ยนแปลงไป โดยไม่ต้องมีการตั้งโปรแกรมใหม่ |
Big Tech Change
| 2020-2021 | 2023-2024 |
| 1. Apple | 1. NVIDIA |
| 2. Meta | 2. Snowflake |
| 3. Unity | 3. Accenture |
There is no AI Strategy without a Data Strategy
- สิ่งที่สามารถ competitive กับคนอื่นได้ด้วย data
- Moving —> Smart data ข้อมูลที่ดี จะได้จากการตั้งคำถามที่ดี
- ปัจจุบันเริ่มมี Agentic Dashboard ผู้บริหารสามารถถาม-ตอบได้เลย
Management Data
| Type | Definition |
| 1. Data Monetization | การที่เราสามารถสร้างรายได้จากข้อมูลที่เรามี |
| 2. Ascent AI | การพัฒนาหรือความก้าวหน้าของ AI |
| 3. Consolidate Data | การรวบรวมข้อมูลมาเพื่อให้ข้อมูลสามารถใช้ทำงานได้ง่าย วิเคราะห์หาข้อมูลเชิงลึกได้ |
AI & Language
Speaker by P. Arm Language and Semantic technology lab
ChatGPT and Generative AI
Story from ปี 2022
- AI can do this task —→ planning, Learning , Problem solving , Social Interaction, Sensation ,Object moving and Communication with language
- AI เริ่มพูดภาษามนุษย์ได้ , เริ่มมีปฎิสัมพันธ์กับมนุษย์ เริ่มเข้าใจหัวใจมนุษย์มากยื่งขึ้น
- Generative AI รับคำสั่ง prompt จากมนุษย์
Generative AI —> ChatGPT —> สร้าง Table —> Vall-E —> สร้างภาพ, เลียนแบบ —> Deepfake —>เลียนแบบริมฝีปาก
| ChatBot | Definition |
| ChatGPT | สร้าง Table |
| Vall-E | สร้างภาพ , เลียนแบบ |
| Deepfake | เลียนแบบริมฝีปาก |
Ability of Generative AI
- ความสามารถของ ChatGPT คือ ถามอะไรก็สามารถตอบได้หมด
- ต้องการสั่งเป็นภาษาอังกฤษ
- ถ้าสั่งเป็นภาษาไทยจะเกิด Hallucination
- Generative AI —> ต้อง brief งานให้ดี
Caution : มีโอกาสจำไปเก็บไว้ใช้งานต่อได้ , มีอาการหลอนได้
Step Create ChatGPT
- โมเดล AI Transformer Model —> TRAIN —>2. Language Model (GPT, Bert) —> FINE-TUNE (ปรับพฤติกรรมด้วยข้อมูลเฉพาะด้าน) —> 3. Dataset ชุดข้อมูลบทสนทนา

- Transformer Model —> ประมวลผลภาษาธรรมชาติ (NLP) รวมถึงการแปลภาษาด้วย
- BERT (Bidirectional Encoder Representations from Transformers) เรียกว่า “Encoder” ซึ่งประมวลผลข้อมูลนำเข้าแบบทั้งซ้ายและขวา เพื่อทำให้เข้าใจบริบทของคำในประโยคได้อย่างละเอียด
- Masked Language Modeling (MLM): ปิดคำบางคำในประโยคและให้โมเดล —> ทำนายคำที่หายไปได้
- Next Sentence Prediction (NSP): ให้โมเดล —> ทำนาย ว่าประโยคสองประโยคที่ให้มานั้นเป็นประโยคที่ต่อเนื่องกันหรือไม่
Transformer Model
-> เปลี่ยนข้อความต้นทางไปยังปลายทาง
- คำปรากฎร่วม
- โครงสร้างวลี
- จับคู่คำสำคัญ
Train วิธีสอน Transformer ให้เป็น LLM ได้
- เลือกปิดบางคำ (mask) ให้ทายคำที่หายไป
- หาโมเดลที่ทายผิด
- ทำซ้ำแบบนี้ให้ครบทุกประโยค
Large Language Model
- สร้างคำแรก ขึ้นมาก่อน
- นำคำที่สร้างมารวมกัน
- สร้างคำถัดไปจากคำก่อนหน้านี้
Game To Test Large Language Model
- จะมีเกมทายคำแบบ Bert
- สอนปิดคำและทายคำ ประมาณ 15%
Open AI _ _ _ _ name is ChatGPT? ——> chatbot คือคำที่หายไป —> Open AI chatbot name is ChatGPT
2. เกมทายคำแบบ GPT (OpenAI)
- ปิดคำที่สะกดจากซ้ายไปขวา ให้ทายบริบทจากด้านซ้าย
Open AI chatbot name is _ _ _ _ _ . ChatGPT คือคำที่หายไป —> Open AI chatbot name is ChatGPT.
3. เกมทายคำแบบ Bart (Facebook)
- เปลี่ยนแปลงรูปประโยค เช่น ปิดบางส่วน สะกดคำผิด บลบางคำ แล้วสร้างประโยคเดิมกลับออกมา (เขียนคำแบบถอยหลัง)
ChatGPT is name _ _ _ _ —> Open AI chatbot คือคำที่หายไปแล้วเรียงจากซ้ายไปขวาด้วย —> Open AI chatbot name is ChatGPT.
FINE – TUNE
- ฝึกให้ตอบคำถาม
- บทความและสรุปสั้นๆ
- ตั้งคำถาม 17,000 ข้อได้อย่างน้อย 4 คำตอบสำหรับ AI
LANTA OpenThaiGPT : https://demo72b.aieat.or.th/ สามารถถามแอปเหล่านี้เป็นภาษาไทยได้
- Chain of thought ควรที่จะรู้จักข้อมูลหลายสื่อ
อุปสรรคและความท้าทาย : มีแต่ข้อมูลขยะเยอะเกินไป เช่น พนันบอล และ ซื้อหวย จึงทำให้มีข้อมูลที่ดีมา Train Model แค่ 20%
Math
Speaker by P. Gui Page คณิตศาสตร์อย่างที่ควรจะเป็น
Mathematics is a science of pattern
- Mathematics is a science of pattern quote by Resnik, Michael (1997)
โดยที่ชีวิตคนเราส่วนใหญ่ เป็น pattern เหมือนหลักคณิตศาสตร์ คณิตศาสตร์ช่วยให้ให้หา pattern ในสิ่งอื่นๆได้เช่นกัน ดังนั้น ยิ่งเข้าใจคณิตศาสตร์มากขึ้นก็มีจะ pattern การดำเนินชีวิตที่ดีขึ้น
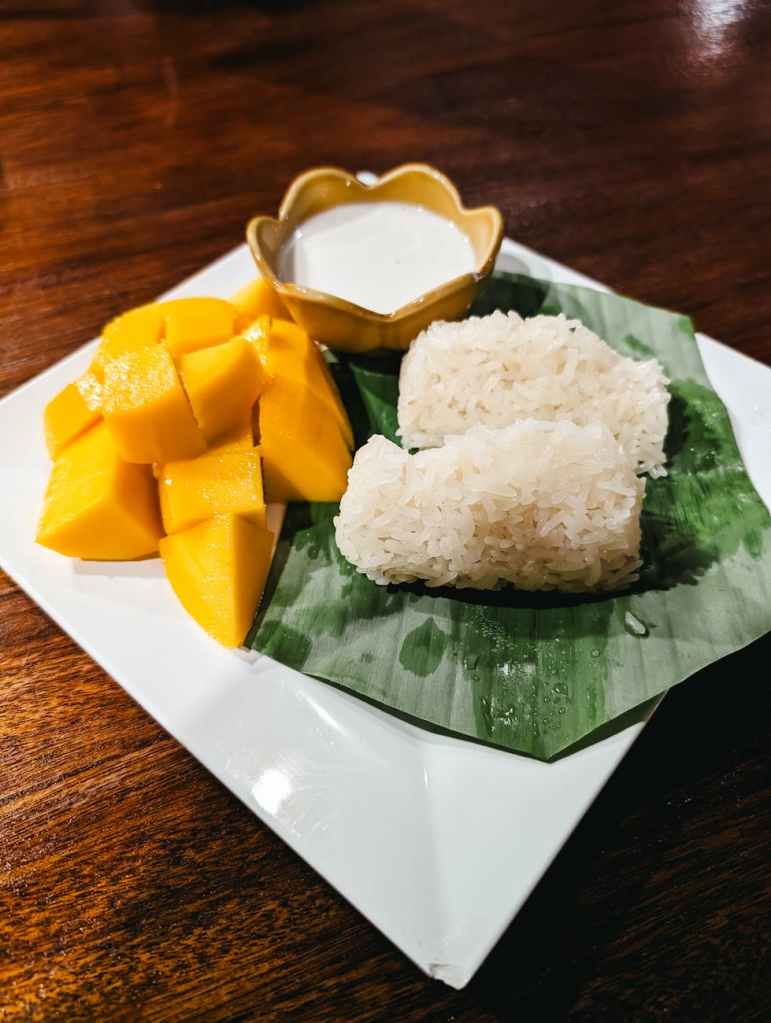
Recipes Food
- เฉกเช่น เดียวกับ ถ้าอยากรู้ว่าจะทำอาหารจานนึง —> ต้องตั้งคำถามว่าสามารถทำได้อย่างไร —> ก็ต้องเปิดสูตรอาหารและทำตาม
- อยากรู้สูตรอาหาร — > อยากเลียนแบบ, อยากเข้าใจเกี่ยวกับการทำอาหาร
- ถ้าเราไม่รู้สูตรอาหารก็ไม่รู้ว่า ควรจะใส่วัตถุดิบอะไรลงไป ถึงจะดี
Nature of Mathematic
- Galileo สามารถเชื่อมโยงวิทยาศาสตร์ได้ด้วยคณิตศาสตร์
- และ Claim (กล่าวอ้าง) จักรวาลนี้ถูกสร้างโดยคณิตศาสตร์
–> คณิตศาสตร์คือเครื่องมือที่ดีที่สุดในการเล่าธรรมชาติ

- เริ่มต้นจาก ความโสดดังรูป ->ทำให้อยากมีเพื่อน และ มีคนคุย หลังจากนั้นก็มีแฟน
- พอมีคนคุยและมีแฟนอาจจะผิดหวังในความรักจึงทำให้อยู่ใน Status Move on
- หลังจากนั้น Move On ก็สามารถกลับไปโสดอีกครั้ง
คณิตศาสตร์ พยายามทำความเข้าใจสิ่งต่างๆ เช่น รถติด การมีแฟน อธิบายได้ด้วยคณิตศาสตร์ขึ้นอยู่กับความเชื่อ
- ถ้ามีความเชื่อที่ถูกต้อง จะมีแนวทางที่ดีขึ้น มเปลี่ยนแปลงในแนวทางที่ดี
- คณิตศาสตร์เป็นเครื่องมือที่ใช้ช่วยแก้ปัญหาต่างๆ โดยที่ไม่เป็นปัญหาจากตัวคณิตศาสตร์เอง
Happiness
Speaker by P. March Fotofile
Fotofile
website : www.fotofile.co.th
- Fotofile is professional camera store.
- หน้าที่ review กล้องถ่ายรูปและเป็น consult ให้บริษัท
- ต้องพยายามเล่าให้ลูกค้าฟังทำไมของเลนด์ของกล้อง ราคา 1,500,000 บาท ของกล้องมือสอง ถ้า ราคา 3,000,000 บาท ของกล้องมือหนึ่ง

| ประเภทสินค้า | ราคาสินค้า |
| กล้องมือหนึ่ง | 3,000,000 บาท |
| กล้องมือสอง | 1,500,000 บาท |
Advantage of Fotofile
- จุดแข็ง FOTOFILE make friend not selling
- หน้าที่ของพี่มาร์ช อบรมพนักงาน , สอนพนักงาน , ห้ามเรียกลูกค้าว่าลูกค้า พยายาม treat และพูดคุยกับลูกค้าให้เหมือนกับเพื่อน เป็นพี่ เป็นน้อง
- ต้องพยายามดึงกำแพงเพื่อให้เป็นกันเองกับลูกค้าแล้วจะสามารถขายสินค้าได้ง่ายขึ้น
- มี 7 สาขาในกรุงเทพและมีรายได้สูง
Scope and Depth
- ยิ่งคนเรามีความรู้กว้าง (generalist) จะสามารถมี Topic คุยกับลูกค้าคนถัดไป ได้หลากหลาย Topic มากยิ่งขึ้น
คนเราควรเป็นคนช่างสงสัยไว้ก่อน ต้องตั้งคำถามบ่อยๆ
- เวลาจะเขียนงานอะไรสักอย่าง ต้องเขียนให้ตัวเองเมื่อ 5 ปีที่แล้ว อ่านและฟังแล้วเข้าใจ
Happiness by P. March
- บางทีมีเงินเยอะแยะมากมาย ก็อาจไม่มีความสุขได้ หากไม่มีเวลาใช้เงิน
- แต่สำหรับบางคนถึงจะมีเงินไม่เยอะ ก็มีความสุขได้เช่นกัน ทุกอย่างขึ้นอยู่กับมุมมองของแต่ละคน
ทุกวันนี้ ทุกสิ่งทุกอย่างเร่งรีบและรวดเร็วเกินไป ปัจจัยสำหรับความสุขคือเวลา
- just call back to old memory
- ช่วงปีใหม่ ลองผ่อนคลายเผื่อโทรไปหาคนที่คิดึงก่อนจะข้ามปี เพื่อให้เวลาช้าลง (Aim waiting face memory)
ใช้กล่องที่ถ่ายแต่รูปฟิล์มเพื่อให้ผ่อนคลายลง และพิถีพิถันเพื่อถ่ายรูปให้สวยและเอียดมากขึ้น

How to survive
Speaker
P. Toy Page DataRockie
Thinking
George Bernand Shaw คนที่พูดถึงเรื่อง thinking บ่อยๆ
| Type of Person | Definition |
| คนส่วนใหญ่ | คิดแบบจริงจังแค่ 2-3 ครั้งต่อปี |
| คนส่วนน้อย | คิดแบบจริงจัง 2-3 ครั้งต่อสัปดาห์ จะช่วยให้การดำเนินชีวิตดีขึ้น |
- คนส่วนใหญ่เมื่ออายุเกิน 45 ปี ถ้าโดนไล่ออกจากงาน จะไม่ค่อยมีทางเลือกในการหางานใหม่และไม่รู้ว่าตัวเองควรเรียนเสริมอะไรถึงจะอยู่รอดได้
- คนเราควรพยายามคิดเรียนรู้ Skill ใหม่ไปเรื่อยๆ เพื่อประโยชน์ในอนาคต
ดังนั้นคนเราควรพยายามคิดแบบ deep thinking ให้เยอะ เพื่อเพิ่มโอกาสในการอยู่รอดในอนาคตได้
- คำถามยิ่งเก่า —>คำตอบจะยิ่งเก่าตาม
- เรื่อง ความสุขและความรัก เป็นเรื่องน่าสนใจของ 20 ปีที่แล้ว แต่ปัจจุบันกลับเป็นเรื่องไม่น่าสนใจเท่ากับ เรื่องของ AI และการสร้างรายได้
How to Survive the next 100 years
The closer you are to reality, the higher your chances of survival
- ยิ่งเข้าใกล้ความจริงของโลกเท่าไร ก็จะมีโอกาสอยู่รอดมากขึ้นเท่านั้น
- การรับฟังในเรื่องเดียวกัน แต่อาจได้มุมมองที่ต่างกัน
Future —> Present —-> Past
Surviving is the New ART Form
- Data ไม่ใช่งานที่ Sexy อีกต่อไปแล้ว คนที่สามารถอยู่รอดในอนาคตคือคนที่ Sexy ที่สุด
The Future
- ทำการทดลองในจินตนาการ “แมวของชเรอดิงเงอร์” —> มีแมวตัวหนึ่งอยู่ในกล่องปิดพร้อมกับอุปกรณ์ที่อาจปล่อยแก๊สพิษได้
- ก่อนที่เราจะเปิดกล่อง แมวอาจจะอยู่ในสถานะ “เป็นหรือตาย” คือแมวมีโอกาสทั้งเป็นและตายเท่ากัน Statue 50%
- เมื่อเราเปิดกล่องเท่านั้น สถานะของแมวจะถูกกำหนดว่าจะเป็นหรือตายได้ 100%
เช่นเดียวกับการโยนเหรียญหัวก้อย ตอนโยนเหรียญยังไม่ออกผล แต่ผลลัพธ์จะออกมาเมื่อตอนที่ยกมือออกมาว่าเหรียญที่ปิดอยู่ เป็นหัวหรือก้อย
- การทำนายอนาคตนั้นยากมาก มีแค่ Dr. Strange ที่จะสามารถทำนายอนาคตได้
- OpenAI version 3 เก่งขึ้นมาก มีแค่ 200 คนที่เก่งกว่า OpenAI ในการเขียน Code
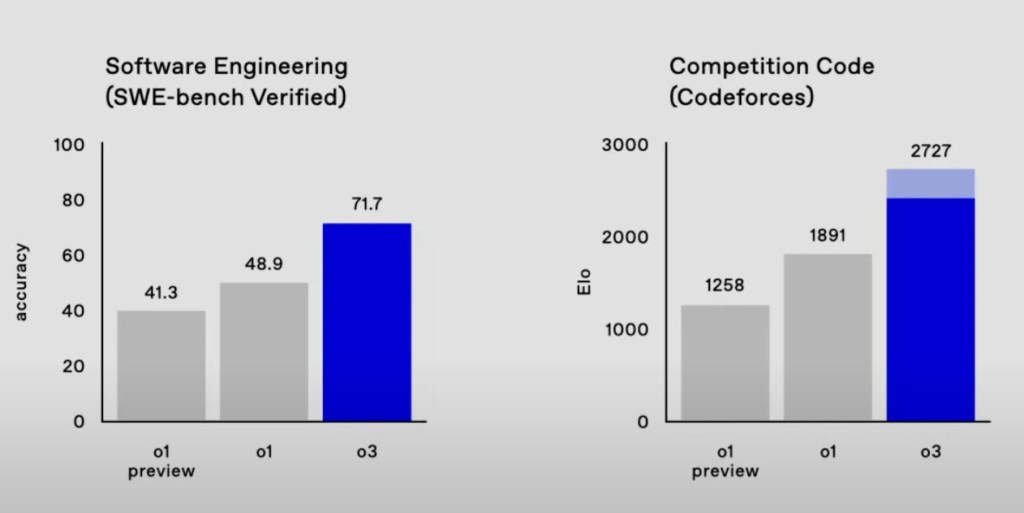
- SWE-bench Verified คือความสามารถในการเขียนโค้ด แก้ไขโค้ด และทำความเข้าใจโค้ดเปลี่ยน OpenAI Version O1 เปิดตัวเดือนกันยายน 2024 เป็น OpenAI Version O3 เปิดตัวเดือนธันวาคม 2024 เพิ่มขึ้น 41.3% เป็น 71.7%

87.5% ทำนายข้อมูลได้เก่งขึ่นใน Computer task
Future Trend in 2025
- AI will get smarter
- A lot of Jobs will be lost
- War and Conflicts around the world
- Climate will get worse
- Another Pandemic
- Economic Crisis
- Living in this world will get tougher
- แสดงว่าปีหน้า เราต้องปรับตัวให้ทันกับโลกที่เปลี่ยนไป
- ความสามารถในการแข่งขันกับเพื่อนบ้านของประเทศไทยน้อยลง
Skill + Internet คือ The New Wealth ที่จะทำให้เราสามารถอยู่รอดได้
The Present
5 Method of good life
- The almanack of Naval Ravikant 5 หลักการในการใช้ชีวิตที่ดีขึ้น
| Type | Definition |
| Wealth | อิสรภาพทางการเงิน ที่ทำให้เรามีเวลาและทางเลือกในการใช้ชีวิตอย่างที่เราต้องการ |
| Judgment | การตัดสินใจที่ดีมาจากการคิดอย่างมีเหตุผล การเรียนรู้จากประสบการณ์ |
| Happiness | ภาวะที่เป็นผลมาจากการใช้ชีวิตที่ดี คือการใช้ชีวิตที่มีความหมาย มีความสัมพันธ์ที่ดี มีสุขภาพแข็งแรง และมีความสงบสุขภายใน |
| Saving Yourself | การลงทุนกับตัวเอง ทั้งในด้านสุขภาพกาย สุขภาพใจ และการพัฒนาตนเอง |
| Philosophy | ปรัชญาชีวิตที่ชัดเจนจะช่วยให้เราตัดสินใจได้ดีขึ้นและใช้ชีวิตอย่างมีความหมายมากขึ้น |
- Wealth is assets that earn you money while you are sleeping.
- หากทำงานเป็นพนักงานประจำ 9.00 – 17.00 ยากมากที่จะสามารถรวยได้ ในสภาวะเศรษฐกิจและโลกปัจจุบัน
Real Estate คือสามารถสร้าง Wealth ได้ โดยที่ Asset นั้นต้องสร้างรายได้ให้เราได้ด้วย
- เช่น ถ้าซื้อบ้าน แล้วให้เช่า จึงจะถือว่าเป็น Real Estate
- แต่ ถ้าซื้อบ้าน แล้วปล่อยทิ้งไว้เฉยๆ ไม่นับเป็น Real Estate
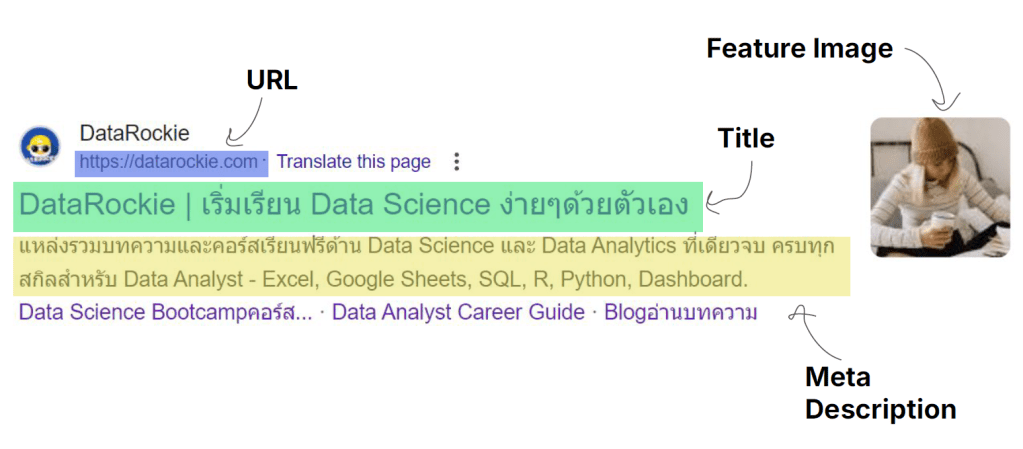
สิ่งที่เราสามารถสร้างให้เป็น Real Estate ของเราได้ คือการมี website เป็นของตัวเอง
- Earn with your mind, not with your time. คือการใช้ความคิดสร้างรายได้ ไม่ใช่แค่ใช้เวลาทำงานแลกเงิน
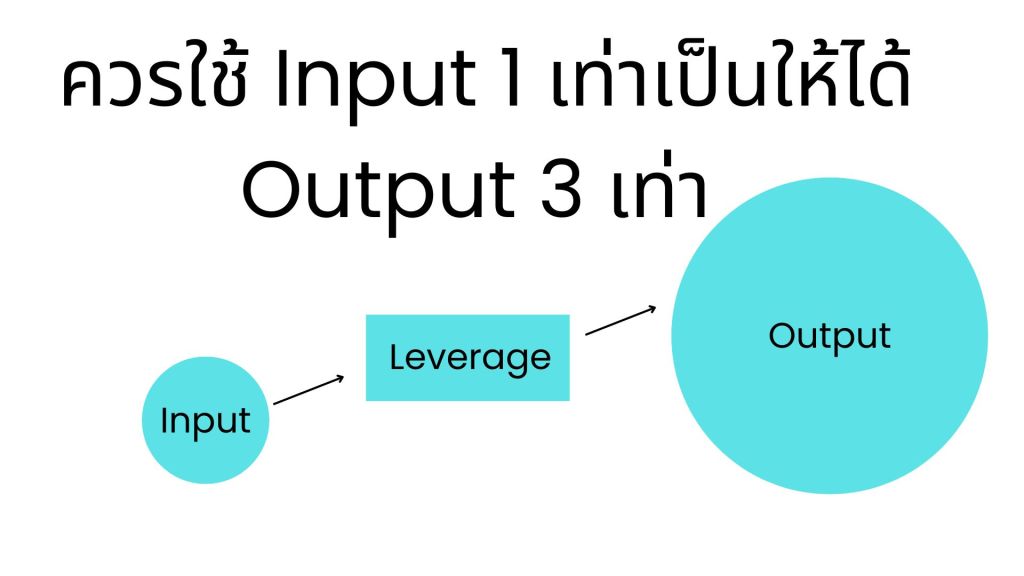
Leverage
- การใช้ Leverage หรือพลังในการทำงานได้ด้วย 3 วิธี
| Type | Definition | Sample |
| Labor | แรงงาน | คนที่เป็นเจ้าของที่ดินหาเงินสร้าง Agriculture |
| Capital | ทุน | คนที่เป็นเจ้าของกิจการ แล้วแจ้งพนักงานมาทำงานให้ตัวเอง โดยให้ทุนไปซื้อเวลาของคนมาทำงานให้ |
| Zero Marginal Cost | ผลิตสินค้าด้วยต้นทุน 0 บาท | สร้าง code และ เขียนบทความเป็นหนทางรอดในอนาคต |
- Digital Asset, Digital Product สร้าง Product ดีๆ
ควรใช้ความพยายาม ( input ) แล้วให้ได้ผลลัพธ์ ( output ) มากขึ้น
What is your hourly rate?
Two choices for discovering yourself within a company.
- เราควรคิดว่า เราควรมีเงินเดือนต่อชั่วโมงเท่าไร
- แล้วสำรวจเงินเดือน ต้องมี Rate ว่าทำงานหรือกิจกรรมที่เราทำแล้วคุ้มกับเงินเดือนมั้ย
1 ชั่วโมงที่เราใช้ดู Tik-Tok หรือ อ่านหนังสือประเภท non-fiction ว่าแบบไหนคุ้มกว่ากัน
Mental Model
- ชีวิตเรามี 2 ทางเลือก เช่น เวลาขึ้นรถไฟฟ้า ระหว่าง เดินขึ้นรถไฟฟ้า หรือ ขึ้นลิฟต์

| Type of way | Definition |
| Easy way | ถ้าทางเลือกทางที่ง่ายไปเรื่อยๆ 10 ปี ทางเลือกข้างหน้าใน 10 ปีข้างหน้าจะยากขึ้น |
| Difficult Way | ถ้าทางเลือกทางที่ยากไปเรื่อยๆ 10 ปี ทางเลือกข้างหน้าใน 10 ปีข้างหน้าจะง่ายขึ้น |
The hard way in the long term is better than the easy way.
The Meta Skills
- 3 Meta Skills ที่ช่วยให้สามารถเพิ่มโอกาสในการอยู่รอดได้ในระยะยาว
| Type of Skills | Definition |
| Reading | การอ่านหนังสือ non-fiction จะทำให้สามารถได้รับประสบการณ์ดีๆจากผู้อ่านที่เขียน เรียบเรียงไว้หนังสือแล้วนำปรับใช้ชีวิตเราได้ |
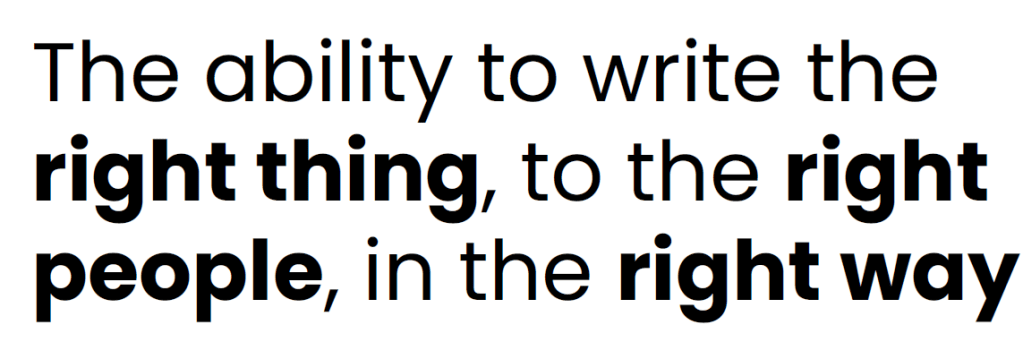
| Writing | การเขียนจะช่วยให้เราสามารถตกผลึกทางความคิดได้มากขึ้นโดยการสรุปความคิดและกลั่นกรองข้อความที่ดีที่สุดสำหรับการเขียนได้ |
| Thinking | การคิดจะทำเรื่องได้ไตร่ตรองชีวิตประจำวันได้มากขึ้น ว่าเราสามารถทำอะไรเพื่อพัฒนาตนเองได้เพิ่มขึ้นบ้าง |
การเรียนรู้ทั้ง 3 Meta Skill นี้จะช่วยให้เราสามารถมีโอกาสในอนาคตได้มากขึ้น
Language proficiency ความเร็วที่จะสามารถใช้ในการความเข้าใจคำผ่าน 4 ทักษะ
| Type | Words per minute |
| Reading | 200-250 |
| Speaking | 120-150 |
| Writing | 40-60 |
| Listening | 120-150 |
Read until you love to read by Naval Ravikant ถ้าไม่ชอบอ่านก็จงอ่านอะไรที่ชอบจนกว่าจะชอบอ่าน
Education
- การศึกษาปริญญาโท ไม่ตอบโจทย์ การเรียน ป.โท ไม่ดีเพราะโดน Corrupt และระบบการศึกษาเปลี่ยนตามโลกยุคนี้ไม่ทัน
ระบบการศึกษาสร้างสิ่งเหล่านี้
- Study to get good grades
- Find a good jobs
- Work for 40 years
- Save money for Retirement
แต่ในโลกของความเป็นจริง เงินเฟ้อ 3% ทุกปี แต่เงินเดือนขึ้นไม่เท่าเงินเฟ้อ
- จึงทำให้ บางทีอาจจะทำเราสามารถ Burnout ได้ เนื่องจากไม่ได้ใช้ชีวิตในสิ่งที่เราอยากทำ
System
Ideology: The ideas that things should be in a social group : อุดมการณ์ คือ แนวคิดที่ว่าสิ่งต่างๆ ควรจะอยู่กันเป็นกลุ่มในสังคม
Capitalism
- Capitalism คือ ทุนนิยม
- If you own something and sell it, we all operate for profit
- หากเราเป็นเจ้าของสิ่งนั้น เราย่อมอยากขายสิ่งนั้น แล้วได้กำไรจากสิ่งนั้น

Fiat Money
- ถ้าองค์กรสร้าง Value ได้ หุ้นจะเพิ่ม แล้วคนก็จะย้ายไปลงทุนในองค์กรที่รายได้ดี
Money → Fiat
- เงินที่รัฐบาลประกาศให้เงินที่ถูกต้องตามกฎหมาย เช่น ทองคำและเงิน เพราะคนเชื่อมั่นในรัฐบาล
Inflation
Compare inflation rate with saving rate
| Type | Percent |
| Saving Rate | 0.5% |
| Inflation Rate | 3.0% |
| Real Interest Rate | -2.5% |
Real Interest Rate = SavingRate(0.5%) – InflationRate(3%) = 0.5% – 3% = -2.5%
- เงินเสื่อมค่าคือปัญหาสำหรับการชีวิตในปัจจุบันหรือไม่ ?
ปัญหาจริงๆ คือ คนส่วนใหญ่ไม่สามารถสร้าง Value ได้
How do you create value?
Create —> Capture —> Store
| Type | Definition |
| Create | การสร้างผลิตสิ่งใหม่อย่างสร้างสรรค์ |
| Capture | แล้วนำสิ่งนั้นไปบันทึกเสียง รูป หรือวิดีโอ |
| Store | การนำข้อมูลไปขายสินค้าหรือผลิตภัณฑ์บางอย่างที่มีคุณค่า |
- ต้องพยายามทำตัวเองให้มี value ไปเรื่อยๆ เพื่อที่จะเป็นทางรอดในอนาคต
Value Beyond Price คนเราสร้างมูลค่าให้ได้ 5 เท่าเงินเดือนให้กับบริษัท
How to create value?
- ถ้าเราสามารถรู้วิธีสร้างสิ่งที่ไม่สามารถโดนแทนที่ได้ โดยที่สิ่งเหล่านั้นเป็น สิ่งที่สังคมยังไม่มี และคนอื่นยังไม่รู้
ที่ปัจจุบันคนส่วนใหญ่ หางานกันไม่ได้ เพราะคนส่วนใหญ่เหมือนถูกปั๊มแบบ Robot จากมหาวิทยาลัยที่สร้างคณะและสาขาที่ไม่ตอบโจทย์ ตำแหน่งในการหางานในตลาดแรงงาน จาก Website สมัครงาน เช่น Jobsdb , Linkedin
Happiness
- เด็กคนหนึ่งมีความสุขมากกว่าผู้ใหญ่
Happiness แบ่งได้เป็น 4 ประเภท
| Type | Definition |
| Choice | ทางเลือกที่สามารถใช้ในการตัดสินใจเลือกสิ่งต่างๆ ในชีวิต |
| Skill | ความสามารถในการสิ่งที่ใดสิ่งหนึ่งที่มีประโยชน์ เช่น การพัฒนาตนเอง |
| Peace | สภาวะของจิตใจที่สงบและสันติ |
| No Desire | ไม่ยึดติดกับสิ่งใด มีความพอใจในสิ่งที่ตนเองมี |
หากมีทั้ง 4 ข้อนี้ ก็สามารถอยู่ในจุดที่สมบูรณ์แบบ มีแต่กิจกรรมที่จะสมบูรณ์แบบและดีต่ออนาคต
Make a Decision Judgement
Judgment is underrated บางทีการตัดสินใจมักถูกประเมินค่าต่ำเกินไป —> ทุกคนสามารถตัดสินใจได้ดีต่อ Long-Term —> Suffer ระยะสั้น —> Long Term ดีระยะยาว
- Wisdom is knowing the long-term consequences of your actions คือ ปัญญาคือการรู้ถึงผลกระทบในระยะยาว

| Type | Definition |
| Long-term consequence | ผลลัพธ์ในระยะยาว เช่น อ่านหนังสือ 1 ชมทุกวัน 10 ปี มีโอกาสได้มีความก้าวหน้าความรู้และงานมากยิ่งขึ้น |
| Short-term consequence | ผลลัพธ์ในระยะสั้น เช่น เล่น Tik-Tok Content ไม่lสร้างสรรค์ 1 ชมทุกวันระยะเวลา 10 ปี โอกาสที่พัฒนาความรู้และหน้าที่การงานจะน้อยลง |
Value vs Price
| Type | Definition |
| Value | มูลค่าคือความพอใจที่ได้รับจากการใช้สินค้าหรือบริการ เป็นสิ่งที่ตัดสินได้ด้วยความรู้สึกหรือความคิดเห็นส่วนบุคคล |
| Price | ราคาคือจำนวนเงินที่ต้องจ่ายเพื่อให้ได้มาซึ่งสินค้าหรือบริการ เป็นตัวเลขที่กำหนดขึ้นมาอย่างชัดเจน |
Water vs Diamond
- Water ถ้าอยู่ในบริบทที่เราอยู่ในทะเลทรายจะมีแค่มากกว่า Diamond เพราะถ้าหากไม่ได้กิน Water จะตายก่อน
- Diamond ถ้าอยู่ในบริบทปัจจุบัน จะมีราคามากกว่า Water แล้วสามารถซื้อ Water ได้ปริมาณมาก
Value is Relative ไม่สามารถวัด Value ได้จริงๆ วัดได้จากบริบทในช่วงนั้นๆ
The Truth
- You can only have make progress when you are starting with the truth.
- ถ้าไม่เริ่มจากการเข้าใจความจริง ชีวิตยากที่จะสามารถเดินในเส้นทางที่ถูกต้องได้
Do we hallucinate?
- ถ้าเราเรียนจบไม่ตรงสาย จะสามารถเป็น data analyst ได้หรือเปล่า
ตัวเราเองคือคนที่สามารถหลอกง่ายที่สุด เพราะว่า หลายอย่างที่เราบอกตัวเองนั้นไม่ได้ถูกต้องทั้งหมด
A Prediction Machine
- Eye สามารถรับข้อมูลจากภายนอกเข้ามาใน Brain : we can see with your brain.

- เป็นการเน้นย้ำการมองเห็นไม่ได้เกิดได้จากดวงตาเพียงอย่างเดียว แต่สามารถเกิดจากการประเมินผลของสมองได้
- ถ้าไป Cat Cafe แล้วเจอ Hippo อยู่ใน Cat Cafe แล้วก็จะรู้สึกขัดกับความเชื่อของเราในตอนแรกเพราะสมองเชื่อว่าจะได้เจอ Cat แต่ตาเราได้เจอกับ Hippo แทน เพราะคนเรามักจะเชื่อว่าถ้าเข้าไปใน Cat Cafe จะต้องเจอ Cat

ในบริบทที่ไป Cat Cafe แล้วสิ่งที่ได้พบ
| Type | ก่อนเข้า Cat Cafe | หลังเข้า Cat Cafe |
| Eye | สิ่งที่คิดว่าเจอ Cat | สิ่งที่เจอ Hippo |
| Brain | สิ่งที่คิดว่าเจอ Cat | สิ่งที่เจอ Cat |
- สำหรับ Brain คาดว่าจะเจอ Cat พอเข้าไปแล้ว ก็ยังรู้สึกว่าจะเจอ Cat อีก
- เกิด Placebo สิ่งที่เชื่อกับสิ่งที่เห็นไม่เหมือนกัน
Hallucination
- คนเรามักจะมีการอาการ Hallucinate ตัวเองโดยที่ไม่รู้ตัว
- Your brain hallucinates, your conscious reality : สมองของคุณสร้างภาพหลอน ความเป็นจริงที่รับรู้ของคุณ
| Type | Definition |
| Hallucination | Uncontrolled Perception |
| Perception | Controlled Perception |
- Your world comes from inside out not outside in.
ตัวเราจะเป็นคนพาเรารอดในอนาคตได้ Productize Yourself
The Past
Old Question
- The older the questions , The older the answer.
- ยิ่งคำถามๆนานที่เก่าเท่าไร คำตอบที่ได้จากในอดีตอาจไม่ก็เหมาะสมกับคำตอบในยุคนี้แล้ว
- เทคโนโลยีที่เจริญที่สุดใน 100 ปีที่แล้ว คือ ไฟฟ้า ถ้าเป็นปัจจุบันเป็น ChatGPT
ความจริงคืออะไร the matrix ไม่ใช่หนัง Sci-fi movie แต่เป็นความจริง
| Type | Definition |
| Red Medicine | เปิดเผยความจริง |
| Blue Medicine | แสดงโลกที่ถูกสร้างขึ้น |

The Kybalion
- The lips of wisdom are closed , except to the ears of understanding
- ปัญญาและความรู้จะไม่เปิดเผยให้ใครฟัง นอกจากผู้ที่มีความเข้าใจและพร้อมที่จะรับฟัง
Raise your awareness ของตัวเราและโลกใบนี้เพิ่มสามารถรับมือและปรับตัวกับโลกที่เปลี่ยนแปลงไป

website : https://www.amazon.com/Kybalion-Centenary-Three-Initiates/dp/0143131680
- ปรัชญาเฮอร์เมติก (Hermetic Philosophy) เป็นปรัชญาของชาวกรีกโบราณ สามารถรับรู้ได้ทุกเรื่องของชาวกรีก เชื่อกันว่าเขียนโดย เฮอร์มีส ทริสเมกิสทัส (Hermes Trismegistus) เหมือน พระไตรปิฎกศาสนพุทธ
Master Keys
- Mentalism
- Correspondence
- Polarity
- Vibration
- Rhythm
- Cause and Effect
- Gender
Mentalism
- Rule : ” The All is Minds; Universal is mental. “
- ถ้าความคิดคือทุกอย่างในจักรวาล, โดยจักรวาลสร้างจากความคิด
- The All is infinite, we are infinite.
- เราเป็นส่วนหนึ่งของสิ่งที่ยิ่งใหญ่กว่าตัวเรา และเรามีศักยภาพที่ไร้ขีดจำกัดที่จะเติบโตและพัฒนาแบบไม่มีที่สิ้นสุด
Formless → Form เปลี่ยนที่ไม่มีอยู่จริง ให้มีอยู่จริงได้ สร้าง (Manifestation)
ความสำเร็จมักเกิดขึ้นในหัวของคนเรา 2 ครั้ง
- ในสมอง 1 ครั้ง
- ความจริงที่ทำได้อีก 1 ครั้ง
- Mental transmutation เอาความคิดไปเปลี่ยนเป็นสิ่งที่เราทำได้
- Capitalism คือไอเดียของคนเรา แต่ถูกจำกัดความคิด
- ต้องทำลายกรอบความคิดว่า เราจะต้องพยายามเก่งขึ้นเพื่อหางานดีๆได้
Country is an idea too and it has been weakened by the internet. Ideas are bulletproof.
- Skill วันนี้คือเอาความเชื่อผิดๆออก แล้วนำความเชื่อที่ดีเข้ามา (พลังความคิดของเรา พลังที่ยิ่งใหญ่ที่สุด)
Correspondence
- Rule : ” As above, so below; as below, so above.”
- มีความสอดคล้องกันของระดับจิตใจไม่ว่าจะเป็นด้านบนหรือด้านล่าง
The Principle of Correspondence
| Type | Definition |
| Spiritual | ระดับจิตวิญญาณ |
| Mental | ระดับจิตใจ |
| Physical | ระดับร่างกาย |
Interconnected
Universe → Mind → Quantum
- ยิ่งเข้าใจจิตใจเราเท่าไร → ชีวิตเราจะดีขึ้นเท่านั้น
- จักรวาลมีความคิดเป็นของตัวเอง ขอแค่เราเข้าใจตัวเองก็พอแล้ว
Polarity
- Rule : Everything is dual; everything has poles; everything has its pair of opposites; like and unlike are the same; opposites are identical in nature, but different in degree; extremes meet; all truths are but half-truths; all paradoxes may be reconciled.
- ทุกสิ่งทุกอย่างที่เกิดขึ้นจะมีคู่กับอยู่ตรงข้ามกันเสมอ แต่ทุกสิ่งทุกอย่างเหล่านั้นเป็นเรื่องเดียวกัน
- เช่น มีซ้ายต้องมีขวา มีหนาวต้องมีร้อน แต่ความน่าจะเป็นที่วัดได้เป็น % เช่น บางคนหนาว 30% ร้อน 70% แล้วแต่สถานการณ์ที่เกิดขึ้น
อย่างเช่นจากชอบมาก ก็สามารถเปลี่ยนเป็นเกลียดมากได้

- การพัฒนาของเทคโนโลยีก็เช่นกัน

| Type | Definition |
| Efficiency | Work smart 2 hours and fun : ทำงานอย่างมีประสิทธิภาพ |
| Great work | Work hard 24 hours and fun : ทำงานอย่างดี แต่ใช้เวลาเยอะ |
| Experiment | Work smart 2 hours and not fun: ทำงานแบบทดลอง แต่ต้องพยายามหางานที่สนุก |
| Bad to place | Work hard 24 hours and not fun : ทำงานผิดทีไม่สนุก |
- บางทีการพยายามเดินทางสายกลางก็เป็นเรื่องที่ดี
- All truths are but half-truths; all paradoxes may be reconciled.
Vibration
- Rule : “Nothing rests; everything moves; everything vibrates.”
- ทุกอย่างในโลกนี้ เคลื่อนไหวอยู่ตลอดเวลา
- ถ้าสามารถควบคุมความคิดตัวเองได้ดี ก็จะดึงดูดสิ่งดีๆ เข้ามาในชีวิตได้
คิด —> ลงมือทำ —> แบ่งปัน
the vibration of mental forces are the first and consequently the secret
- The brain มีทั้งหมด 5 ระดับ ชีวิตจะดีขึ้นได้โดยมี Higher Mental
to change your mood or mental state, change your vibration
- หากต้องการเปลี่ยนอารมณ์หรือสภาวะจิตใจของคุณ จงเปลี่ยนการสั่นสะเทือนของคุณ
- หากคุณกำลังอารมณ์ไม่ดีหรือเหนื่อยจงนอนพัก เพื่อผ่อนคลายอารมณ์เหล่านั้น
Rhythm
- Rule : “Everything flows, out and in; everything has its tides; all things rise and fall; the pendulum-swing manifests in everything; the measure of the swing to the right is the measure of the swing to the left; rhythm compensates”
- ชีวิตคนเรามีขึ้นมีลง มีได้มีเสีย ตลอดเวลา ชีวิตจะต้องมีการ Trade off เสมอ เป็นเรื่องธรรมชาติ
| Type | Definition |
| Short Term Pain | สบายวันนี้ ลำบากวันหน้า |
| Long Term Gain | ลำบากวันนี้ สบายวันหน้า |
- Never Ending ไม่มีทางหลุดพ้นได้
- คนเราจะพยายามเปลี่ยนตัวเองจาก Physical เป็น Mental
Choose not to be harmed, and you will not feel harmed
Cause and Effect
- Rule : “Every Cause has its Effect; every Effect has its Cause; everything happens according to Law; Chance is but a name for Law not recognized; there are many planes of causation, but nothing escapes the Law.”
- ทุกอย่างที่เกิดขึ้นบนโลกไม่มีเรื่องบังเอิญ ทุกอย่างต้องมีเหตุมีผล
- โชคจะต้องมีบางอย่างถึงเกิดสิ่งนั้นขึ้นได้
No luck is change of luck is a name for Law not recognized.
ความไม่มีโชค คือการเปลี่ยนผันของโชค เป็นชื่อที่ใช้เรียกกฎที่ถูกมองข้าม
- อย่างเช่น ถ้าเรามาไม่มีโชค อาจจะไม่รวยแต่ทำให้เราสู้ชีวิต แล้วเราก็รู้จักคุณค่าของเงินกับความรู้และสามารถรักษาไว้เงินกับความรู้
- กลับกัน หากมีโชค แล้วเราถูก lottery แล้วกินอาหารแพงทุกวัน สุดท้ายเงินก็อาจจะหมดได้ หากไม่มีความรู้และสติในการใช้เงิน
The Unbreakable Chain ห้ามเปลี่ยนเวลาในอดีต สำหรับการย้อนเวลา เพราะจะทำให้เกิดผลในอนาคต
A Small change in the past —> Compound —> Big impact in future

- พยายามเปลี่ยนตัวเองให้เป็น Cause แล้วไม่เปลี่ยนตัวเองให้เป็น Effect
Gender
- Rule : “Gender is in everything; everything has its Masculine and Feminine Principles; Gender manifests on all planes.”
- เพศอยู่ในทุกสิ่ง ทุกสิ่งมีหลักการชายและหญิง เพศปรากฏในทุกรูปแบบ
- หลักการชายและหญิงอยู่ในทุกสิ่ง ซึ่งไม่ใช่แค่เพศทางกายภาพรือนิสัย แต่เป็นหลักการของพลังงานที่สร้างสรรค์และรับรู้
- คนๆนึงสามารถมีอารมณ์ได้ทั้ง 2 แบบ คือ ผู้หญิงและผู้ชาย ควรมี 2 รูปแบบให้เหมาะสมกับการใช้ชีวิตเรียกว่า Masculinity and Femininity
| Feminine | Masculine |
| Emotion | Reason |
| Creative | Act |
| Soft | Strong |
| Yin | Yang |
- เหมือนการตัดสินใจที่สามารถมีได้ 2 ระบบ
| Type | Definition |
| System 1 | Action, Fast, Emotion |
| System 2 | Think, Slow, Controlled |

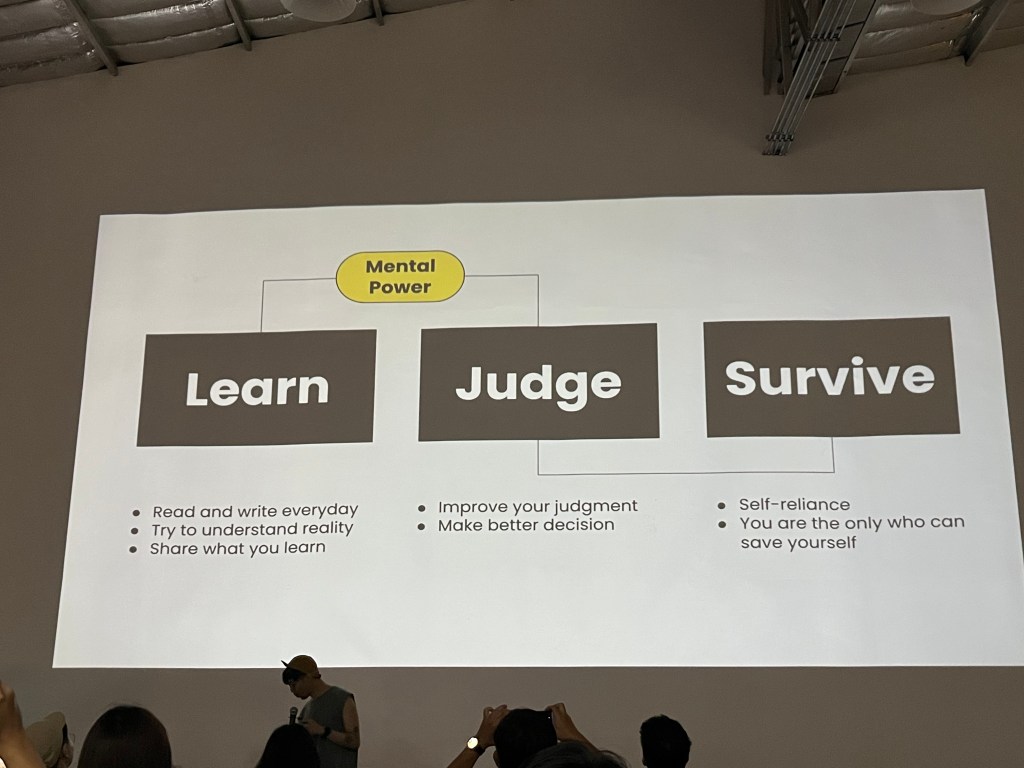
Mental Power
| Type | Definition |
| Learn | อ่านและเขียนทุกวัน |
| Judge | ตัดสินใจให้ดีขึ้น |
| Survive | เราสามารถพัฒนาตัวเองได้ด้วยตัวเอง |
โดยสรุปเนื้อหานี้เน้นย้ำว่าโลกกำลังเปลี่ยนแปลงอย่างรวดเร็ว โดยเฉพาะด้าน AI ที่ฉลาดขึ้น ทำให้หลายอาชีพเสี่ยงตกงาน รวมถึงปัญหาอื่นๆ เช่น สงคราม สภาพอากาศเลวร้าย โรคระบาด และวิกฤตเศรษฐกิจ การปรับตัว พัฒนาทักษะ และใช้ประโยชน์จากอินเทอร์เน็ตจึงเป็นสิ่งสำคัญในการอยู่รอด โดยเฉพาะทักษะการอ่าน เขียน และคิด รวมถึงการสร้างสิ่งที่สังคมยังขาดแคลน หวังว่าทุกคนจะได้ประโยชน์จากบทความนี้ครับ

ขอบคุณงาน #Whattheduck2024 ที่ทำให้ได้รับโอกาสดีๆครับ